
Week · Market review
Week: US growth slows, but costs are not easing
From 30 September to 6 October, US data showed growth but raised more questions about its durability. September added far fewer jobs than August, while Monday’s services survey combined slower expansion with greater cost pressures. US shares nevertheless rose alongside bond yields on 5 October: weaker economic figures do not yet mean cheaper funding.
Period covered: 2026-09-30 – 2026-10-06Information as of 7 min read
The US services survey released on 5 October showed slower expansion and stronger cost pressures. Germany’s August orders report, published on 6 October, revealed how much large contracts influenced the headline decline.
Higher market yields improve the terms for a new bond buyer but can reduce the value of existing bonds. Companies remain exposed when old debt has to be replaced with more expensive borrowing.
Week
What happened
30 September: US economic growth was revised higher
On 30 September, the US Bureau of Economic Analysis revised second-quarter real gross domestic product growth from an annualised 1.5% to 2.2%. That is growth of 0.6% from the previous quarter, not 2.2% over three months. The stronger April–June estimate increases the measured pace of earlier growth, but does not establish how the economy performed in September.
2–4 October: US jobs growth slowed while energy risks persisted
On 2 October, the US Bureau of Labor Statistics reported that nonfarm payrolls rose by 29,000 in September, following a revised increase of 133,000 in August. The combined July and August result was revised down by 60,000. The weakness was not confined to the latest month: the earlier path of jobs growth was also lower than previously reported.
The September unemployment rate was 4.2%. Slower jobs growth can limit growth in household income and discretionary spending. These figures do not by themselves establish an economy-wide downturn, however.
? Unemployment rate: what is the denominator?
It is the share of the labour force who are not employed, are actively looking for work and are available to work, rather than a share of the whole population. Unemployment and payroll figures come from different surveys, so their monthly movements need not match.
Also on 2 October, Eurostat’s flash estimate showed euro area annual consumer inflation rising from 3.2% to 3.8% in September. These are prices paid by consumers, not the producer selling prices discussed below. On 4 October, seven countries in the OPEC+ group of oil producers retained September production targets for November; these are agreed volumes, not confirmed actual oil supply.
US shares rose alongside bond yields
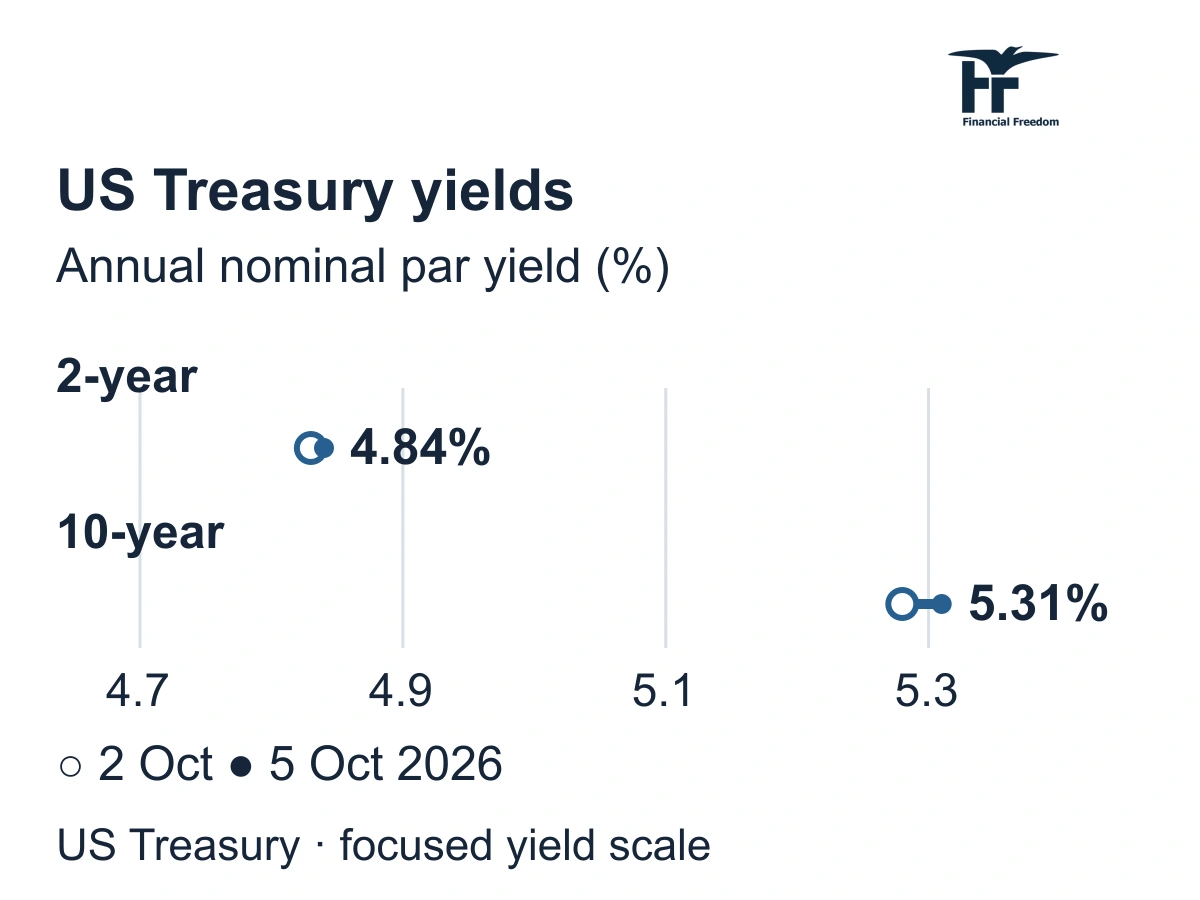
On 5 October, the Nasdaq Composite index of US-listed shares rose 1.05% from its 2 October close. This is a price change in US dollars, not a euro return. The US Treasury’s 10-year yield increased from 5.28% to 5.31% on the same day.
? Bond yields: what does the change mean?
These are nominal annual US Treasury yield-curve estimates based on indicative market prices, not returns earned over a day. A rise from 5.28% to 5.31% is 0.03 percentage points, or 3 basis points; it does not change a bond’s fixed payments.
US services growth slows while cost pressures intensify
On Monday, 5 October, the US Institute for Supply Management released its September Services Purchasing Managers’ Index (ISM Services PMI). It fell from 55.4 to 54.9 points but remained above the expansion threshold. Meanwhile, the prices index rose from 72.6 to 74.0 points. Business activity was therefore growing more slowly while cost pressures were intensifying.
? Services and prices indexes: what do they measure?
The survey compares business conditions with the previous month. The services index gives equal weight to activity, new orders, employment and supplier deliveries; a reading above 50 points indicates expansion overall. The separate prices index measures how widespread price increases are, so 74 points does not mean 74% inflation.
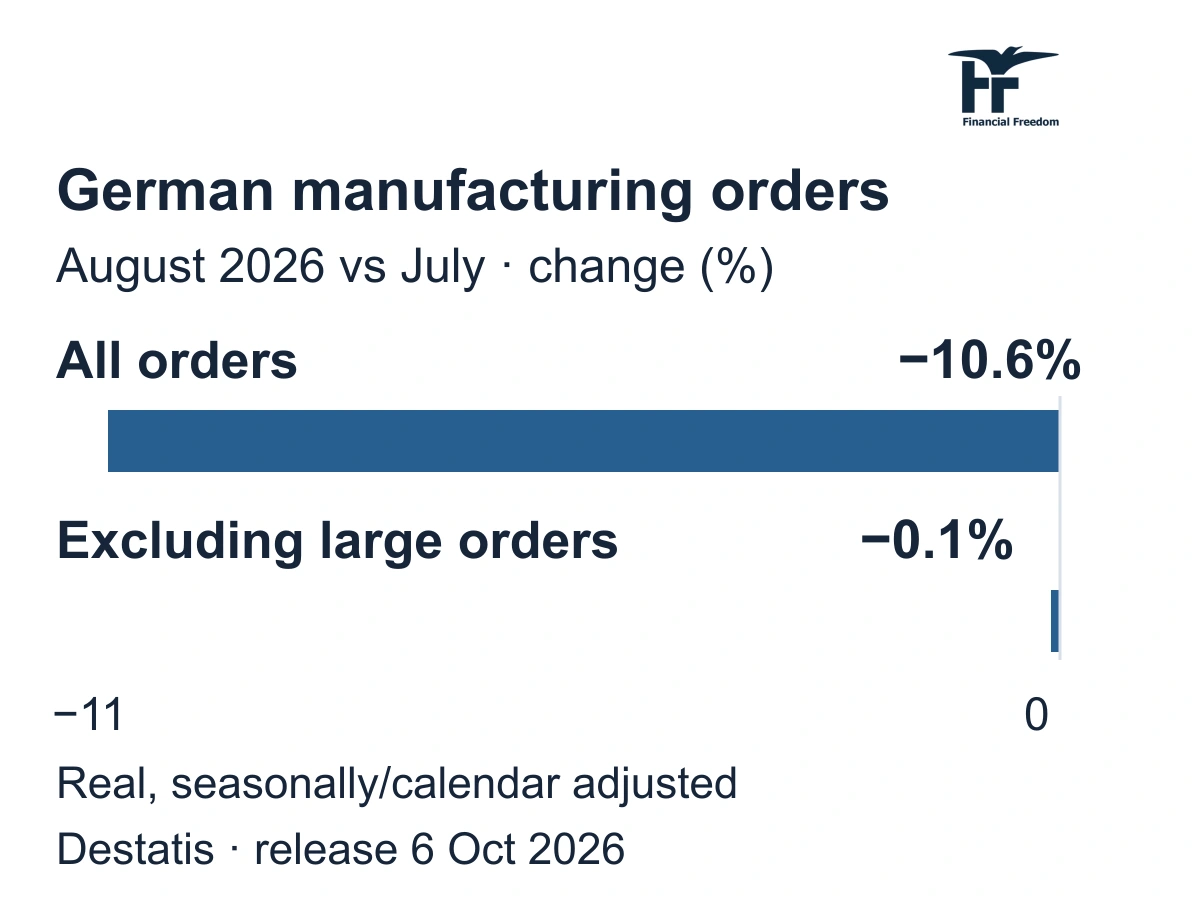
German orders fell 10.6%, but that is not the pace of decline across all industry
For your investments
Let’s discuss your portfolio
 FINANCIAL FREEDOM01 / 04
Investment results since 1999
Are you beating
global equities?

at the end of the period
Jan 1999–Jun 2026 · EUR · Cumulative return, %
Linear scale · * MSCI World → MSCI ACWI.
Past performance does not guarantee future returns.
FINANCIAL FREEDOM02 / 04Historical comparison
How far did it fall?
How long to recover?
Decline from the previous high

Longest recovery to the previous high

Jan 1999–Jun 2026 · EUR · Monthly data
* MSCI World → MSCI ACWI.
Past performance does not guarantee future returns.
FINANCIAL FREEDOM03 / 04Personal investment consultation
Already investing?
Let’s review your portfolio.
Yet to start
investing?
Let’s build your first
investment plan.
FINANCIAL FREEDOM04 / 04
Personal investment
consultation
Martynas
Juška
Investment manager
Managing a portfolio
of more than€100 million
Most of the decline came from the category covering ships, aircraft, trains and military vehicles. July had brought an exceptionally high volume of large contracts in this category. Such orders arrive unevenly, while production and payments can take much longer. One weak month for orders is therefore not the same as an equivalent loss of revenue already earned.
Even so, the weakness is not just statistical noise. In June–August, orders excluding large contracts were 2.6% below the previous three months. A weaker flow of regular orders makes it harder for industrial component and equipment manufacturers to keep their factories busy in the future.
? Manufacturing orders: what does this measure show?
The measure tracks new orders received by manufacturers after removing the effect of price changes. The monthly comparison is seasonally and calendar adjusted; August figures are provisional. An order is not a product already made or revenue received, while the measure excluding large contracts helps reveal the steadier flow of business.
Energy prices are rising much faster than other producer prices in Europe
On 5 October, Eurostat reported that euro area industrial producer prices had risen 1.9% month on month in August. Energy prices rose 5.6%, while total industry excluding energy recorded just 0.2%. This is not an equally sharp increase everywhere: businesses buying energy face the greatest pressure.
Profits at chemical, metal and other energy-intensive manufacturers may fall if higher electricity or fuel costs cannot be offset by higher selling prices. Energy suppliers may gain revenue from higher prices, but their profits also depend on their own costs and the volume sold.
On the same day, European Central Bank Executive Board member Philip Lane explained the other side of this pressure: expensive energy leaves households with less money for other purchases, while higher long-term interest rates restrain consumption and investment. Inflation risks can therefore rise even as demand weakens. This was his assessment, not a new interest-rate decision.
? Industrial producer prices: what does this measure show?
The Industrial Producer Price Index measures manufacturers’ selling prices in the domestic market, not their entire cost basket or consumer inflation. The comparison is between August and July; the energy category’s 5.6% is not its percentage-point contribution to the overall measure.

Investment consultation
Do your investments work together?
Review where your money is invested, how much depends on a single market and whether your plan fits your goals. Leave with clearer next steps.
See the consultation process and terms on the registration page.
Week
What matters now
Why do rising shares not yet ease borrowers’ problems?
Interest rates are not the only influence on shares: improving profit expectations can offset more expensive borrowing. But higher refinancing costs can reduce profits for heavily indebted property companies. Bonds present a different distinction: a new buyer receives a higher yield, while the market prices of existing fixed-payment bonds generally fall. Longer-dated bond funds usually respond more strongly. One Monday of rising shares does not remove this risk.
Retailers and leisure companies still have opportunities to increase sales, but higher operating costs can reduce profits. For logistics businesses, the question is whether these costs can be passed on to customers. If not, profit margins narrow. Nevertheless, the survey does not yet point to a broad decline in demand: expansion continues, albeit at a slower pace.
In Europe, sales volumes matter as well as higher prices
Transport-equipment manufacturers with large contracts may have better prospects than the headline figure suggests. A wider range of industrial suppliers still faces the risk of weaker demand, limiting revenue and profit.
Consumer businesses need to watch whether customers cut discretionary purchases. Weaker demand could support bonds if it reduces future inflation, but prolonged energy price increases would work in the opposite direction.
The dollar strengthened slightly against the euro
The ECB reference rate was 1.1204 US dollars per euro on 5 October, compared with 1.1225 on 2 October. Other things equal, a stronger dollar increases the euro value of unhedged dollar assets, but also makes imports paid for in dollars more expensive. The investment’s final return also depends on the asset price. This is Monday’s reference rate, not a live Tuesday transaction price.
Week
What comes next
On 6 October, Eurostat’s August retail trade release is scheduled for after this review’s data cutoff. It will show whether the volume of goods purchased by households increased despite higher energy prices.
On 7 October, Destatis will publish German production data for August. Did factory output also fall, or did work on earlier orders sustain production volumes?
On 7 October, the Federal Reserve will release the minutes of its 15–16 September meeting. They will explain how policymakers assessed inflation and growth risks at that time, but will not yet reflect their response to data released in October.
On 8 October, the ECB is scheduled to publish the account of its 9–10 September monetary policy meeting. How were energy inflation risks and economic resilience assessed at the time? This will explain an earlier decision, not set interest rates anew.
On 8 October, Federal Reserve Governor Christopher Waller is due to speak about the economic outlook. His assessment of slower growth alongside continuing price increases will be particularly relevant.
Important. This is general market analysis, not a personal recommendation to buy or sell. Historical data and company results do not guarantee future returns. Forecasts and conditional scenarios may not materialise.
How is the history preserved and updated?
All five periods in this edition share one information date. Week means the latest 7 days, quarter means 90 days, and year means the trailing 12 months. The next dated edition will have a separate URL. This text keeps its date and assessment; later events are not silently inserted into an older edition. Longer periods assess new evidence alongside earlier developments without repeating every headline.