
Today · Market review
Oil price forecast rises as retail recovery stays weak
On 6 October, the US Energy Information Administration raised its year-end oil price forecast, keeping expensive fuel a risk for transport companies. On the same day, US bond yields fell, while August retail trade data showed only a small recovery in the euro area. Company profits depend on whether weak sales growth can cover higher costs.
Period covered: 2026-10-07Information as of 6 min read
The new EIA outlook projects more expensive oil at year-end, while the euro area retail release shows only a small rebound from July’s decline. US bond yields fell, reversing the direction of the previous session.
Oil supply depends on more than announced plans: reserves and Middle Eastern exports must actually reach buyers. Company profits also depend on whether higher costs can be passed on to customers.
Today
What happened
The oil forecast rose, but the new reserve plan is not yet included
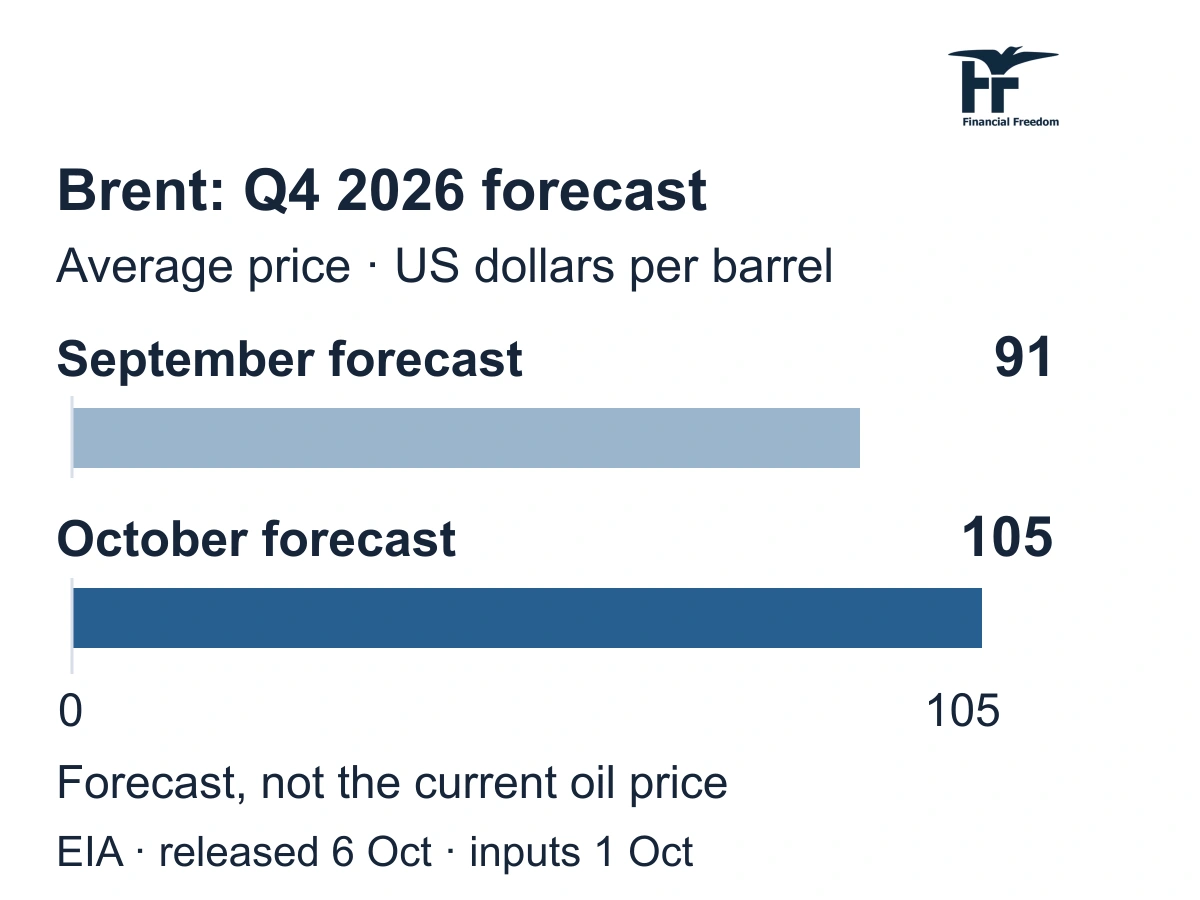
On 6 October, the US Energy Information Administration (EIA) raised its forecast for the average Brent oil price in the fourth quarter of 2026 from $91 to $105 a barrel. That is an increase of about 15.4% in the forecast for the same period. The agency expects oil supply from the Middle East to increase, but assumes that constraints will not disappear during the quarter.
Why does more supply not necessarily mean fuel will become cheaper quickly? In the EIA’s assessment, oil inventories are still falling and tight diesel supplies encourage refiners to seek more crude. While transport routes remain constrained, individual additional cargoes may only reduce the shortfall rather than immediately restore normal market conditions.
However, the inputs for the new forecast were finalised on 1 October. It therefore does not include the additional effect of the Group of Seven (G7) plan announced on 2 October: member countries committed to a coordinated release of 100 million barrels of oil and petroleum-product reserves over four months. This is planned supply, not confirmation that the entire volume has already reached the market. The actual pace of deliveries could change the supply–demand balance projected by the EIA.
? Brent forecast: what is being compared?
Brent is an important international oil benchmark; the comparison is between two forecast releases for the same October–December average price, not daily prices. The percentage change is calculated from the earlier $91 figure using the EIA’s rounded values. The agency’s forecast is neither a current transaction price nor a guaranteed future outcome.
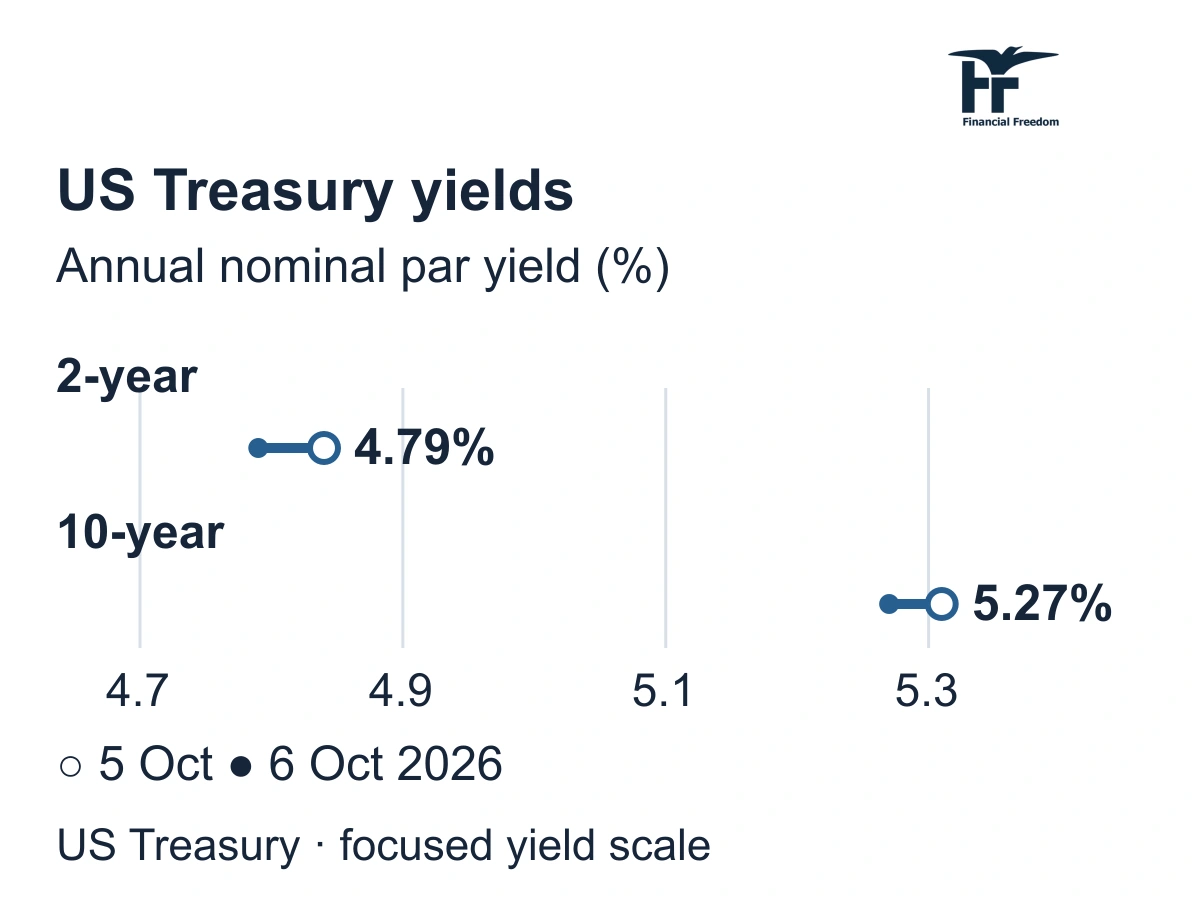
The US 10-year Treasury yield eased to 5.27%
On 6 October, the annual yield on the 10-year US Treasury fell from 5.31% to 5.27%. The two-year yield declined from 4.84% to 4.79%, while the 30-year yield moved from 5.66% to 5.64%. Investors buying US government bonds in the market therefore faced slightly lower yields than on Monday.
Friday provides a useful sense of scale: the 10-year yield was 5.28% on 2 October, almost the same as Tuesday’s reading. This was a small fluctuation, not sufficient evidence that a lasting decline in borrowing costs had begun.
? Bond yield: what does it show?
The US Treasury derives these indicative annual rates from market prices for each remaining maturity. Four basis points equal 0.04 percentage points; this is neither a bond fund’s return nor a reduction in the Federal Reserve’s policy rate.
For your investments
Let’s discuss your portfolio
 FINANCIAL FREEDOM01 / 04
Investment results since 1999
Are you beating
global equities?

at the end of the period
Jan 1999–Jun 2026 · EUR · Cumulative return, %
Linear scale · * MSCI World → MSCI ACWI.
Past performance does not guarantee future returns.
FINANCIAL FREEDOM02 / 04Historical comparison
How far did it fall?
How long to recover?
Decline from the previous high

Longest recovery to the previous high

Jan 1999–Jun 2026 · EUR · Monthly data
* MSCI World → MSCI ACWI.
Past performance does not guarantee future returns.
FINANCIAL FREEDOM03 / 04Personal investment consultation
Already investing?
Let’s review your portfolio.
Yet to start
investing?
Let’s build your first
investment plan.
FINANCIAL FREEDOM04 / 04
Personal investment
consultation
Martynas
Juška
Investment manager
Managing a portfolio
of more than€100 million
Euro area purchases recovered only slightly after July’s decline
On 6 October, Eurostat reported that euro area retail trade volume rose 0.1% in August from July, when it had fallen 0.6%. The rebound did not offset the previous month’s loss. This measure of actual goods sales volumes adds to the earlier signs of weakness in European industry.
The headline masks different trends: non-food products excluding automotive fuel rose 0.5%, while automotive fuel sales in specialised stores fell 1.9%. Changes in energy prices alone cannot explain all consumption. Purchases of some goods increased while volumes of others declined, so one conclusion would not fit every retailer.
? Retail trade volume: how does it differ from revenue?
The measure tracks sales after removing the effect of price changes, and this monthly comparison is seasonally and calendar adjusted. It does not measure company profits or cover every service bought by households. Higher prices can increase cash revenue even when fewer goods are sold.

Professional portfolio management
A plan for your portfolio. No rush.
Let’s discuss your goals, risk tolerance and time horizon. Find out how your portfolio would be built and managed.
The first conversation is free, with no obligation.
Today
What matters now
Transport costs and oil producers’ revenue can move in opposite directions
For airline and road-haulage shares, the question is how much fuel costs will reduce profits and how much can be passed on to passengers or freight customers. Higher realised prices can support oil producers’ revenue if they can extract and deliver their output. Hedging contracts and sales volumes determine how quickly oil price changes feed through to each company’s results.
Consumer businesses need buyers, not just higher prices
For non-food retailers, rising sales volumes offer more scope to cover fixed store and logistics costs. Fuel retailers may offset lower volumes with higher cash sales, but profits depend on the difference between purchase and selling prices. European consumer-goods manufacturers still face the risk that rising essential household expenses will limit other purchases. The small overall recovery does not yet provide a broad foundation for sales growth across the sector.
A stronger euro helps importers but reduces the euro value of dollar assets
The European Central Bank reference rate was $1.1269 per euro on 6 October, compared with $1.1204 on 5 October. A stronger euro cushions the cost of dollar-priced oil for euro area importers. However, the currency move reduces the euro value of an investor’s unhedged dollar assets if their dollar price is unchanged. A rise in a US bond’s price can therefore differ from the change in its value in euros.
? ECB reference rate: how should it be read?
The figure shows the number of US dollars per euro; an increase means a stronger euro. It is an informational daily reference rate, not the price of a particular transaction. Its fixing time differs from the US market close, so these rates alone cannot precisely convert that session’s equity return.
Bondholders and future borrowers face different effects. When market yields decline, the prices of existing fixed-rate bonds generally rise; longer-maturity US bonds can respond more strongly. Shares in heavily indebted property companies have a different potential benefit: lower refinancing costs. However, a company’s borrowing rate also depends on its credit risk. A four-basis-point daily move does not alter an existing loan agreement. If inflation expectations or the assessment of the borrower’s risk deteriorate, that relief could disappear.
Today
What comes next
7 October, 09:00 Lithuania time. Germany’s statistical office Destatis is scheduled to release August production figures. Will the volume of goods already produced confirm the weak orders figures, or did earlier contracts keep factories busy?
7 October, 17:30 Lithuania time. The US Energy Information Administration is scheduled to publish its weekly petroleum report for the week ending 2 October. Will US crude oil and petroleum-product inventories point to growing shortages or stabilising conditions? This measures US inventories, not global stocks.
At 21:00 Lithuania time on 7 October, the Federal Reserve is scheduled to release the minutes of its 15–16 September meeting. The key question is how participants assessed inflation and the risk of slower economic activity; the minutes describe an earlier meeting, not a new decision based on October’s news.
8 October. The European Central Bank is scheduled to publish the account of its 9–10 September monetary policy meeting. It will help explain how the council assessed energy inflation and weaker demand, but will not be a new interest-rate decision.
At 11:30 Lithuania time on 8 October, Federal Reserve Governor Christopher Waller is scheduled to speak on the economic outlook. Will his assessment of US inflation and economic growth differ from the conditions discussed at the September meeting?
Important. This is general market analysis, not a personal recommendation to buy or sell. Historical data and company results do not guarantee future returns. Forecasts and conditional scenarios may not materialise.
How is the history preserved and updated?
All five periods in this edition share one information date. Week means the latest 7 days, quarter means 90 days, and year means the trailing 12 months. The next dated edition will have a separate URL. This text keeps its date and assessment; later events are not silently inserted into an older edition. Longer periods assess new evidence alongside earlier developments without repeating every headline.