
Quarter · Market review
Quarter: borrowing costs and uneven trade
Over 90 days, trade restrictions, unreliable energy supply and rate rises changed company costs. Technology suppliers’ growth contrasted with uneven industrial demand. Bond-market relief on 8 October was accompanied by a European financial-stability warning about debt and technology concentration.
Period covered: 2026-07-12 – 2026-10-09Information as of 23 min read
US 2-, 10- and 30-year Treasury yields fell on 8 October. New German export data showed a decline, while the ECB meeting account and Waller’s speech announced no new rate decision.
The US target range remains 3.75–4.00%, and the euro area deposit rate is 2.50%. A one-day decline in bond yields does not change payments on existing fixed-rate loans.
Quarter
What happened
The starting point: interest rates had already risen on 17 June
This rolling 90-day period begins on 12 July. Before it began, on 17 June, the European Central Bank’s previously announced interest rate increase took effect. The rate on banks’ overnight deposits rose from 2.00% to 2.25%. These are the initial conditions before the period under review, not a new event within it.
Also on 17 June, the Federal Reserve left the federal funds target range at 3.50–3.75%. It made no change on 29 July. Europe also chose a pause on 23 July. For a business with debt, this meant that energy costs would not be offset by automatically and rapidly falling interest rates.
The starting backdrop: the 18 June agreement had not yet restored shipping
On 18 June, the US announced the signing of a memorandum with Iran. For oil buyers, implementation mattered more: whether ships could sail safely, insurance would be available and oil would actually reach them.
More reliable deliveries would have reduced importing industries’ need to hold expensive inventories. Hauliers would have found fuel and route planning easier. But the agreement itself was not a statistical record of restored flows. July and August data later required a more cautious assessment of precisely this assumption.
July: the supply recovery was not sustained
Just before this period began, the International Energy Agency’s 10 July review described a partial recovery in June flows and ceasefire violations on 7–8 July. Its 12 August report said Persian Gulf oil exports in July, including routes bypassing the strait, averaged 15 million barrels per day. That was 2.1 million, or about 12%, below June.
This comparison describes two monthly averages, not a one-day shipping halt. It showed that June’s hopes had not been enough to deliver a lasting improvement. US military statements on 5 and 8 September about strikes on Iranian tankers were a reminder that delivery security remained unresolved. A particular price move cannot be attributed solely to these statements.
23 July: trade rules and sanctions added to the planning burden
The European Union’s 21st sanctions package against Russia expanded restrictions on energy, financial services and the shadow fleet. For companies, this matters beyond politics: payment, insurance and cargo transport options change. But an announced restriction is not a measured fall in exports of the same size.
On 23 July, the Office of the US Trade Representative announced tariff measures on imports from 60 economies, including the European Union. The action concerned insufficient bans on importing goods made with forced labour. Tariffs and exemptions depended on the product and its origin. US importers had to check whether ordered goods would become more expensive, while their overseas suppliers faced the risk that higher final prices would weaken demand.
Late July and August: technology suppliers earned revenue while customers invested
Technology suppliers’ revenue grew while their customers spent heavily on equipment and infrastructure. On 29 July, Microsoft reported capital expenditure, including finance leases, of 41 billion US dollars for the quarter ended 30 June. Cash purchases of property and equipment were 35.8 billion dollars. These amounts must not be added together: the first includes finance leases, while the second shows asset purchases paid for in cash during the quarter.
The company generated 55.4 billion dollars in operating cash flow. Subtracting cash purchases of property and equipment left 19.6 billion dollars. This explains why a rapid pace of construction is not automatically a bad signal: what matters is how much cash the business generates and how much more it needs from outside.
On 26 August, chip designer NVIDIA reported revenue of 96.221 billion dollars for the quarter ended 26 July, up 106% year on year. Operating profit grew 124%. Some customer spending had therefore already become real earnings for the supplier. For customers to earn a return on their investments, however, their new services need demand and must cover equipment, electricity and financing costs.
August and September: growth continued, but costs did not disappear
Both the US and euro-area economies grew in the second quarter. The third estimate of US gross domestic product, published on 30 September, showed annualised growth of 2.2%, or 0.6% quarter on quarter. The second US estimate released on 26 August had been lower. Euro-area growth was revised to 0.6% quarter on quarter on 7 September. On the same quarterly comparison basis, growth in the two regions matched.
The initial US estimate for August, released on 4 September, showed 162,000 additional jobs, but the gain was revised to 133,000 on 2 October. On 9 September, second-quarter revenue growth in selected US service industries was revised to 3.0% from the previous quarter. This revenue measure has not been adjusted for prices. Rising sales and a greater real volume of services delivered are therefore not the same thing.
9–11 September: a higher energy-price forecast was followed by an ECB rate increase
On 9 September, the US Energy Information Administration raised its second-half average Brent price forecast to about 90 dollars per barrel. Model inputs were finalised on 3 September. This is a conditional average for a future period, not the oil price in a particular September session and not an already measured effect of later military action.
On 10 September, the European Central Bank announced another interest rate increase of 0.25 percentage points. The deposit facility rate rose from 2.25% to 2.50% on 16 September. On 11 September, the US Consumer Price Index showed annual inflation of 3.4% in August, the same as in July. The seasonally adjusted monthly change accelerated from 0.1% to 0.4%. These data were known before the Federal Reserve meeting of 15–16 September, which subsequently raised the target range.
? How should we read GDP and price indices?
Gross domestic product measures the value of final goods and services produced in an economy. Real growth removes the effect of prices. US quarterly growth is often reported at an annualised rate, as if the same change continued for four quarters. The Consumer Price Index measures a basket of prices weighted by consumption. Its annual and monthly changes have different comparison bases. The Personal Consumption Expenditures Price Index also includes spending made on consumers’ behalf, uses different weights and accounts for changes in the composition of consumption; these two price indices should not be treated as interchangeable.
Mid-September: June’s hopes were not enough to restore supply
The International Energy Agency’s 11 September forecast projected a larger fall in oil supply than in demand this year. This is a forecast, not the final annual result.
Lower demand does not automatically mean cheaper oil. If the volume reaching buyers falls faster, fuel bills can remain high even as the economy slows. This can help an energy producer only if it can deliver its output. For a haulier or an energy-buying factory, the same situation raises costs.
16–24 September: US bond yields rose again after a brief decline
On 16 September the Federal Reserve raised its target range to 3.75–4.00%. An earlier European decision lifting the deposit rate to 2.50% took effect on the same day. The US ten-year yield fell to 4.96% on 21–22 September, but reached 5.18% on 24 September. The fall in US bond yields was therefore short-lived.
The preliminary S&P Global US PMI Composite Output Index, covering manufacturing and services activity, reached 58.4 in the release of 23 September, compared with 56.0 in August. Seasonally adjusted initial unemployment benefit claims of 197,000 for the week ending 19 September, released on 24 September, at that time added to the evidence that the economy was not weakening sharply. On 1 October, that week’s claims were revised to 198,000; the newer week ending 26 September recorded 197,000. Claims are not a count of jobs created or a final measure of an entire quarter’s growth.
? Purchasing Managers’ Index: what does the threshold mean?
The company survey compares activity with the previous month. Above 50 generally indicates expansion and below 50 contraction. A reading of 58.4 does not mean growth of 58.4%; the preliminary measure may be revised.
September’s decisions extended beyond the US and euro area. On 18 September the Bank of Japan set an overnight interest-rate target of 1.25%, effective from 24 September. On 17 September the Bank of England left Bank Rate at 3.75%. These different paths matter for Japanese bonds and yen-funded investments, as well as British companies’ borrowing costs.
25–28 September: uneven demand and trade relief not yet in force
US August durable-goods orders, reported on 25 September, reached $338.6 billion and were virtually unchanged from revised July. Orders for non-defence capital goods excluding aircraft nevertheless rose 1.6%, while shipments increased 0.6%. These are monthly changes adjusted for seasonality, but not for prices. On the same day, the University of Michigan’s final September consumer sentiment index stood at 48.1, compared with 51.7 in August. Business-equipment demand and households’ assessments were therefore sending different signals.
On 27 September, the White House published US and Chinese lists covering about $30 billion of imports in each direction, proposed for lower tariffs. The US list of imports from China includes plastic tableware and bedding; China’s list of imports from the US includes beef and dairy products. This publication did not bring tariff reductions into force. On 28 September, China reported that August profit at larger industrial enterprises was 4.2% higher than a year earlier; July’s growth was 11.2%. These are year-on-year comparisons; they do not show whether profit rose or fell from July to August. Companies’ profits would depend not only on lower tariffs, but also on selling more goods at profitable prices.
30 September: spending remained resilient while energy prices rose
Figures released by the US Bureau of Economic Analysis on 30 September showed real consumer spending rising 0.6% month on month in August, while real disposable income was unchanged. The Personal Consumption Expenditures Price Index, or PCE, was 3.4% higher year on year; excluding food and energy, the increase was 3.0%. July’s annual readings were identical in the same revised data series.
Germany’s preliminary national September inflation rate rose from 2.9% to 3.3%, with energy inflation increasing from 10.5% to 14.9%, while the rate excluding food and energy remained at 2.4%. France’s measure under the common European methodology rose from 2.6% to 3.4%. On the same day, China’s manufacturing Purchasing Managers’ Index rose from 49.8 to 50.1, but its new-orders index fell from 50.6 to 50.5 and the raw-material purchase-price index increased from 56.6 to 60.8. The different indices showed growing activity alongside uneven cost increases.
US Energy Information Administration figures released on 30 September put commercial crude stocks at 427.3 million barrels in the week ending 25 September, 2.6% above a year earlier. Petrol inventories were nevertheless 7.4% lower, and distillates, including diesel and heating products, 14.9% lower. A rise in crude stocks therefore did not by itself resolve the question of finished-fuel supply.
30 September: memory-chip maker Micron reported higher revenue
For your investments
Let’s discuss your portfolio
 FINANCIAL FREEDOM01 / 04
Investment results since 1999
Are you beating
global equities?

at the end of the period
Jan 1999–Jun 2026 · EUR · Cumulative return, %
Linear scale · * MSCI World → MSCI ACWI.
Past performance does not guarantee future returns.
FINANCIAL FREEDOM02 / 04Historical comparison
How far did it fall?
How long to recover?
Decline from the previous high

Longest recovery to the previous high

Jan 1999–Jun 2026 · EUR · Monthly data
* MSCI World → MSCI ACWI.
Past performance does not guarantee future returns.
FINANCIAL FREEDOM03 / 04Personal investment consultation
Already investing?
Let’s review your portfolio.
Yet to start
investing?
Let’s build your first
investment plan.
FINANCIAL FREEDOM04 / 04
Personal investment
consultation
Martynas
Juška
Investment manager
Managing a portfolio
of more than€100 million
1 October: orders held up while new borrowing cost more
The Institute for Supply Management’s September manufacturing survey, released on 1 October, put its Purchasing Managers’ Index at 54.5. Activity was still expanding, but the prices-paid index increased from 71.1 to 77.9. For a manufacturer, this means an opportunity to sell more without necessarily earning more if higher material costs cannot be passed on to customers.
On the same day, the European Central Bank reported that the euro-area new mortgage rate indicator rose to 3.60% in August, consumer credit rates to 7.92%, while the corporate borrowing cost indicator was almost unchanged at 3.77%. These are averages for new agreements, not changes in payments on existing Lithuanian loans. August statistics do not yet show the effects of the subsequent September rate increase.
Eurostat reported on 1 October that Lithuanian house transaction prices were 14.3% higher year on year in the second quarter, against 4.0% in the euro area. This April–June comparison describes prices, not rental income or net investment returns. A home buyer needs to consider both the purchase price and future mortgage payment, but later euro-area lending rates cannot be presented as the cause of earlier Lithuanian price growth.
2–4 October: US jobs growth slowed while energy risks persisted
On 2 October, the US Bureau of Labor Statistics reported that nonfarm payrolls rose by 29,000 in September, following a revised increase of 133,000 in August. The combined July and August result was revised down by 60,000. The weakness was not confined to the latest month: the earlier path of jobs growth was also lower than previously reported.
The September unemployment rate was 4.2%. Slower jobs growth can limit growth in household income and discretionary spending. These figures do not by themselves establish an economy-wide downturn, however.
? Unemployment rate: what is the denominator?
It is the share of the labour force who are not employed, are actively looking for work and are available to work, rather than a share of the whole population. Unemployment and payroll figures come from different surveys, so their monthly movements need not match.
Also on 2 October, Eurostat’s flash estimate showed euro area annual consumer inflation rising from 3.2% to 3.8% in September. These are prices paid by consumers, not the producer selling prices discussed below. On 4 October, seven countries in the OPEC+ group of oil producers retained September production targets for November; these are agreed volumes, not confirmed actual oil supply.
5–6 October releases: higher costs and uneven demand
On 5 October, the Nasdaq Composite share-price index rose 1.05% from its 2 October close, measured in US dollars. The US 10-year Treasury yield meanwhile increased from 5.28% to 5.31%. These are different market measures: rising share prices do not establish that companies can borrow more cheaply.
On 5 October, the US Institute for Supply Management’s September Services Purchasing Managers’ Index (ISM Services PMI) fell from 55.4 to 54.9, while its prices index increased from 72.6 to 74.0. Activity expanded more slowly but cost pressures became more widespread.
? Services and prices indices: what do they measure?
The services survey index gives equal weight to activity, new orders, employment and delivery times. A reading above 50 indicates prevailing expansion compared with the previous month. The separate prices index measures the breadth of price increases: 74 points does not mean 74% inflation.
On 6 October, Destatis reported that German manufacturing orders fell 10.6% in August from July, but only 0.1% excluding large contracts. The category covering ships, aircraft, trains and military vehicles had received unusually large orders in July. Even so, June–August orders excluding large contracts were 2.6% below the preceding three months, leaving regular demand weak.
? Manufacturing orders: how do they differ from revenue?
These are new orders adjusted for prices, seasonal effects and the calendar; August figures are preliminary. An order is not yet a finished product or collected revenue. The overall series and the population excluding large contracts are not additive components of the decline.
On 5 October, Eurostat reported that euro area industrial producer prices rose 1.9% in August from the previous month, with energy up 5.6% and industry excluding energy up 0.2%.
? Producer prices: what do they not show?
The Industrial Producer Price Index measures domestic selling prices, not a company’s entire input-cost basket or consumer inflation. August is compared with July; the energy group’s 5.6% rise is not its percentage-point contribution to the overall index.
Also on 5 October, ECB Executive Board member Philip Lane explained that costlier energy leaves households less money for other goods, while higher long-term interest rates constrain consumption and investment. This was his assessment, not a new interest-rate decision.
6 October retail data: the recovery remains small
On 6 October, Eurostat reported that euro area retail volumes rose 0.1% in August after declining 0.6% in July. Non-food volumes increased 0.5%, while fuel fell 1.9%. This was a small overall recovery with different product groups moving in different directions.
? Retail volume: how does it differ from revenue?
The volume measure removes price changes, and the monthly comparison is seasonally and calendar adjusted. It therefore describes changes in quantities sold, not retailers’ revenue or profit.
7 October: September Fed minutes and long-term borrowing
The US central bank’s 15–16 September minutes, released on 7 October, recalled that most participants had then envisaged another rate rise. The 0.25-percentage-point rise decided on 16 September took effect the next day, taking the range to 3.75–4.00%. These were earlier meeting discussions, not a new October decision.
On 7 October, the US Treasury sold a further $39 billion of 10-year bonds at a high yield of 5.30%, with a bid-to-cover ratio of 2.77. The next day’s 30-year auction, discussed below, has a different maturity, so their yields do not measure the price change of one bond.
Waller leaves further rate rises open despite few layoffs
On 8 October, Governor Christopher Waller of the US central bank, the Federal Reserve (Fed), assessed the latest labour market information: in his view, the labour market remains stable while inflation is too high. He expects further rate increases if economic data develop as he anticipates, but increases need not come at consecutive meetings. This is his assessment, not a new Fed decision.
? Fed rate projections: what do they show?
In September, 16 of the 18 meeting participants envisaged at least one further rate increase at the year’s two remaining meetings; four of those 16 envisaged two. These are individual projections conditional on economic developments, not probabilities or a promise. The target range in force since 17 September is 3.75–4.00%.
On 8 October, the US Department of Labor reported 197,000 initial unemployment benefit claims for the week ending 3 October, compared with a revised 199,000 the previous week. Low claims indicate few layoffs but do not establish rapid job creation. These figures add to the slower jobs-growth picture discussed earlier and help explain why Waller still considers the labour market stable.
? Unemployment benefit claims: what do they measure?
This is a weekly, seasonally adjusted count of claims under state unemployment insurance programmes, not a count of everyone losing a job or of new jobs created. In this release, the previous week’s figure was revised from 197,000 to 199,000; the comparison uses that revised base.
Daily yields fell, but new long-term government borrowing cost more than in September
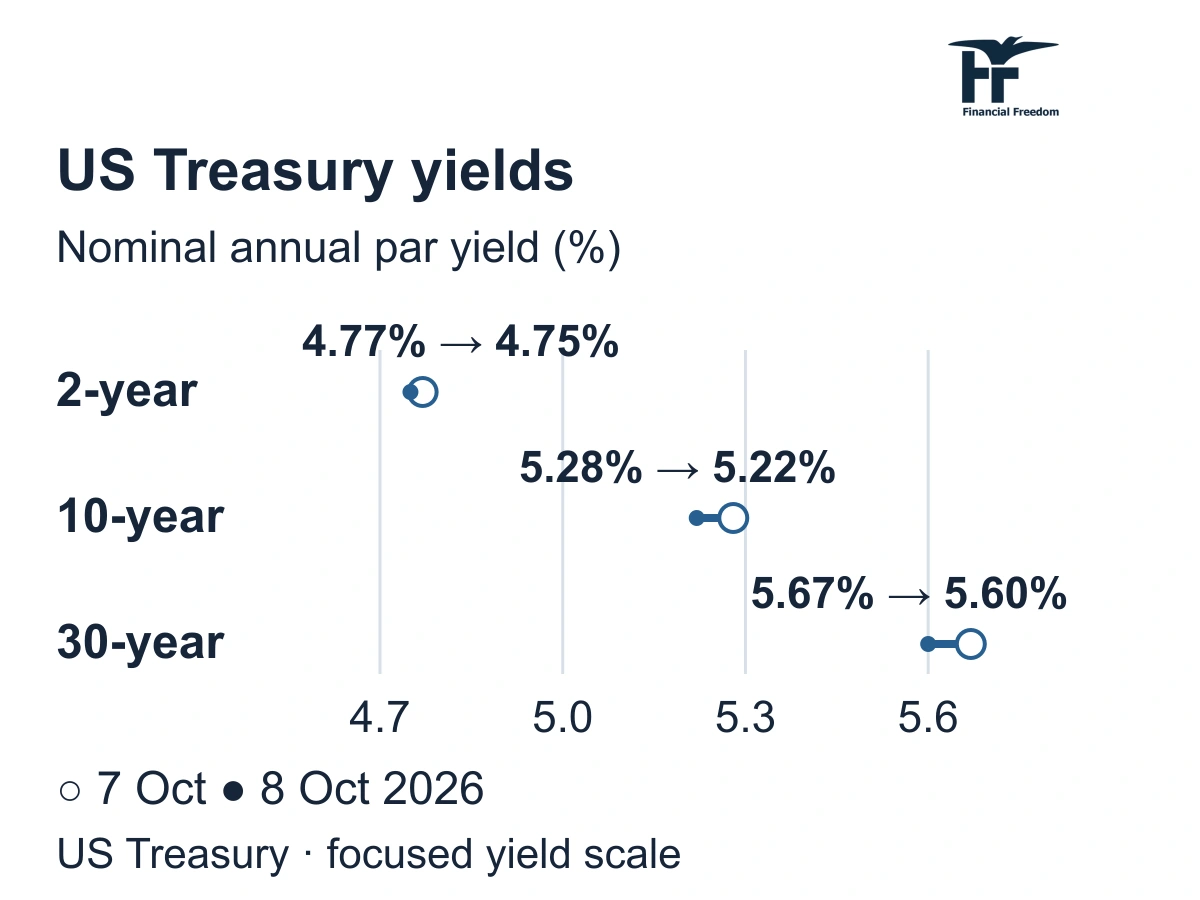
On 8 October, annual US Treasury yields fell at all three maturities being tracked. The two-year yield was 4.75%, the 10-year yield 5.22%, and the 30-year yield 5.60%. Compared with 7 October, they declined by 2, 6 and 7 basis points respectively. Longer-term yields fell more than shorter-term yields that day, but a one-day move does not establish the longer-term direction of interest rates.
Also on 8 October, the US Treasury reopened an existing 30-year bond, offering $22 billion. The highest accepted annual yield was 5.618%, compared with 5.308% at the 10 September reopening of the same issue. Thus, although daily market yields fell, the government borrowed at this auction at a yield 0.31 percentage points higher than a month earlier.
? Yields and auctions: why are they not the same measure?
Daily yields are derived from indicative quotations around 15:30 New York time, while the auction took place earlier and sold a specific bond issue. One basis point is 0.01 percentage points; yield is not an investment return already earned. The auction’s public bid-to-cover ratio declined from 2.61 in September to 2.54 in October: it does not count unique buyers or guarantee subsequent price direction.
The ECB explained September’s rate increase without promising the next step
On 8 October, the ECB’s account of the 9–10 September meeting showed that all Council members supported the rate increase discussed earlier. There was no new rate decision that day.
The Council was concerned about energy becoming more expensive for longer. However, September’s discussion had not yet found broad transmission to wages and other prices. The distinction matters: dearer fuel raises costs but does not itself establish that all prices will accelerate at the same pace. The ECB neither promised another increase nor declared September’s step the last.
Fuel delivery remains relevant following the International Energy Agency’s 7 October statement on faster fulfilment of March reserve commitments. That day, the US Energy Information Administration reported distillate stocks of about 105.1 million barrels in the week ending 2 October, 12% below the corresponding five-year seasonal average. These are earlier weekly inventories, not today’s oil price or a new reserve volume already delivered.
? Distillate stocks: what do they measure?
Distillates include diesel and heating oil. US stocks are compared with the five-year average for the corresponding season; this does not describe worldwide inventories or determine the fuel price.
German exports fell, but sales to different destinations diverged
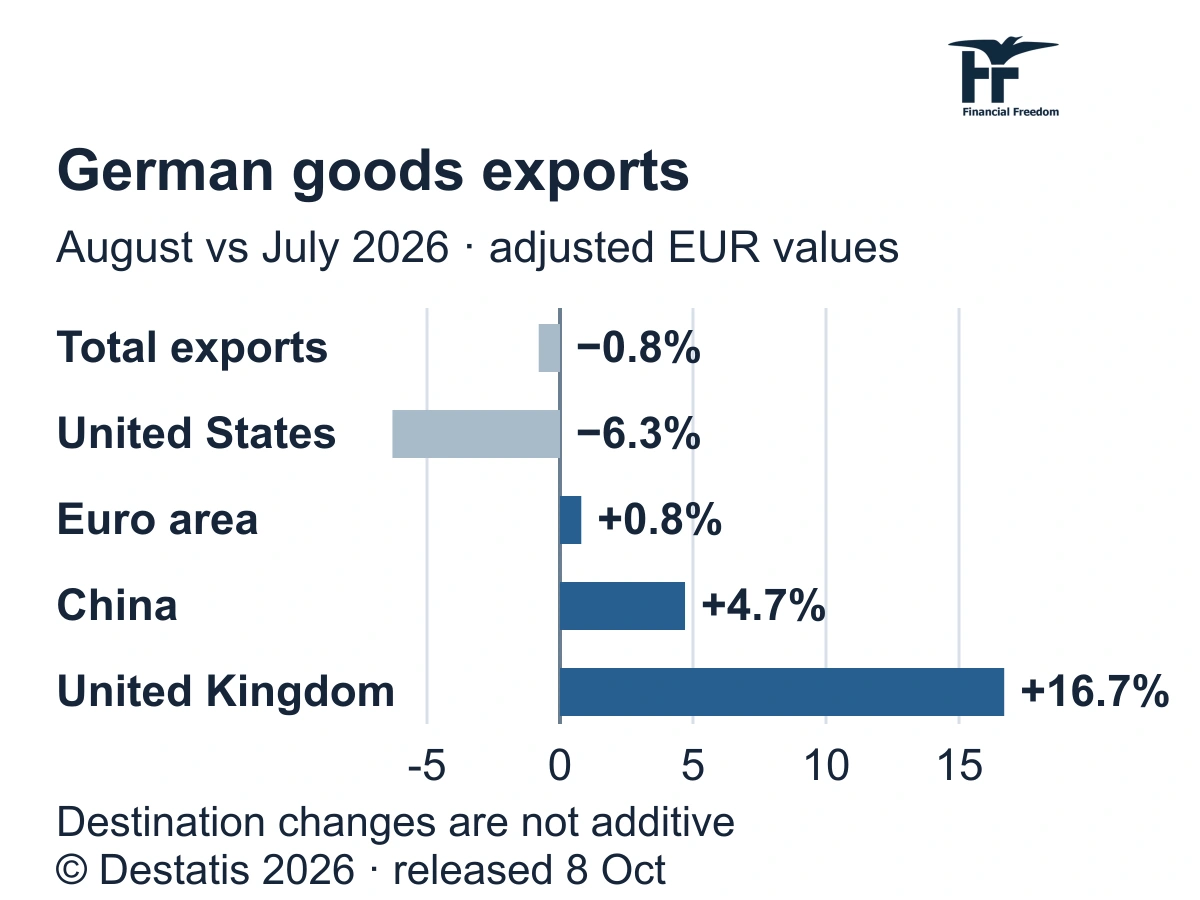
The rise in Germany’s August production reported on 7 October was mainly driven by construction; trade figures released on 8 October showed that exports had not recovered in the same way that month. According to the statistical office Destatis, August goods exports fell 0.8% from July to €137.6 billion. Imports rose 0.9% to €118.1 billion. The goods trade surplus narrowed from July’s €21.6 billion to €19.5 billion.
The clearest new difference is between destination markets. Exports to the United States fell 6.3%, while shipments to the euro area rose 0.8%, China 4.7% and the United Kingdom 16.7%. Exporters did not experience a uniform decline. Moreover, sales to the US remained 22.6% above August 2025: the monthly fall did not erase the earlier year-on-year increase.
These figures do not yet explain which goods or causes produced the differences. The decline in exports to the US therefore cannot simply be attributed to tariffs: a more detailed goods breakdown and companies’ own sales may still change the assessment.
? Export change: what is being compared?
August and July goods values in euros are calendar and seasonally adjusted. They measure nominal value, not physical quantities alone. Destination changes are not additive contributions to the total; the annual comparison uses a different denominator.
Europe’s risk assessment linked technology borrowing and profit expectations
On 8 October, the European Systemic Risk Board published the assessment from its 1 October meeting: EU financial-stability risks had increased during the preceding quarter. The Board highlighted technology companies borrowing to expand artificial intelligence and the risk that future profit expectations may be too optimistic. This is a warning about a possible scenario, not a report of those companies already defaulting.
The risk extends beyond technology shares. More expensive government debt servicing reduces fiscal room, while funds investing with borrowed money can amplify bond-market swings. Conversely, the Board noted European banks’ strong capital, liquidity and profitability. Technology-financing concentration is smaller in the EU than in the US, so the two regions should not be treated as carrying identical risks.

More time for what matters to you
Who looks after your portfolio?
Portfolio management covers investment selection, risk monitoring and rebalancing. Let’s discuss whether this approach would suit you.
The first conversation is free, with no obligation.
Quarter
What matters now
A daily decline in yields can benefit holders of long-maturity fixed-rate US bonds, whose market prices generally move in the opposite direction. However, Waller’s conditional outlook for further rate increases remains a risk if new data show persistent inflation. An investor buying a new bond sees a lower daily yield than a day earlier; that is different from a change in the price of a bond already owned.
Property and infrastructure companies need to consider the terms on which they can refinance debt. A lower government bond yield may help, but a company’s borrowing cost also depends on its risk and contract; a daily move does not change the payment on an existing fixed-rate loan. For consumer goods companies, few layoffs support continuity of household income, while slow job creation limits the scope for demand growth. Bond holdings and consumer equities therefore receive different signals.
The rate outlook depends on costs spreading, not on oil alone
The prices of longer-dated fixed-rate euro bonds and heavily indebted property companies could face pressure if future data encourage further rate increases. Shorter-dated euro bonds are less sensitive to that price change. Less inflation transmission would improve the prospect of longer bonds recovering, but a reserve commitment alone is not enough.
Freight and industrial companies need actual fuel deliveries, while refiners’ profits depend on the gap between product selling prices and crude purchase costs. Restored supply could lower the former’s expenses but weaken refiners’ benefit from product scarcity. The same supply improvement affects different portfolio holdings differently.
The ECB reference rate was $1.1186 per euro on 8 October, compared with $1.1177 on 7 October. The small euro appreciation reduces the euros needed for an unchanged dollar-priced import and reduces the euro value of unhedged dollar assets if their dollar price is unchanged. This describes the currency effect, not the entire investment result.
? ECB reference rate: how should it be read?
The number is US dollars per euro. It is an informational daily rate, not an execution price, and its timing differs from the US market close. Asset-price changes and a currency hedge can alter the overall result.
An exporter’s sales geography matters more than the national headline
For German exporters of machinery, equipment and other industrial goods, weaker sales in a particular market can reduce capacity utilisation and profits. Companies selling into other expanding markets have a potential offset, but national trade data do not establish their results. Within European equity funds, geographic revenue exposure should be distinguished from a company’s country of registration.
Logistics and distribution companies depend on both flows: more imports can provide work even while exports fall. However, nominal goods values are not cargo quantities. The opportunity is demand in different markets providing an offset; the risk would be broader order weakness combined with higher fuel and borrowing costs.
Technology shares and corporate bonds can share the same underlying risk
Data-centre construction supports demand for chips and electrical equipment at suppliers; operators funding that construction need new service revenues to cover debt and electricity costs. A technology equity fund and a corporate-bond fund are not entirely independent if both depend on the same companies investing heavily in artificial intelligence. Shares depend on future profits; bonds depend on the ability to pay interest and repay debt. If substantial investment produces less revenue, both valuations could weaken. This is a conditional risk, not a forecast of unavoidable losses.
Bank-share valuations depend on whether customers’ ability to repay loans is deteriorating, not simply on financing becoming dearer. A fund spanning different borrowers and regions can be less dependent on one group of technology companies, but its name alone does not establish that diversification. Upcoming business-distress data will help test whether higher expenses are translating into actual payment difficulties.
Quarter
What comes next
9 October. Germany’s statistical office is scheduled to publish July business-insolvency data. Are financial difficulties increasing, and what will this add to the industrial and credit-risk assessment? July is the measurement period, not today’s insolvency count.
At 17:00 Lithuania time on 9 October, the University of Michigan is scheduled to release its preliminary October consumer survey. Are consumers’ inflation expectations and assessments of their finances changing? This will inform the consumption outlook, but expectations are not price changes that have already occurred.
At 15:30 on 14 October, the US Bureau of Labor Statistics will release September’s consumer price index. It will show whether actual price pressure is easing and help assess how the latest data compare with Waller’s view.
14 October. The International Energy Agency is scheduled to publish its Oil Market Report, informing the supply, refining and demand outlook.
15 October, 19:00 Lithuania time. The US Energy Information Administration will release data for the week ending 9 October: will distillate stocks begin to recover?
At 20:00 on 28 October, the Fed is scheduled to announce its meeting decision. Data released before then will inform whether rates are held or raised again; Waller’s 8 October remarks do not replace that decision.
29 October. The European Central Bank will take its next monetary-policy decision. The central question is whether new inflation and wage data justify further rate increases or whether transmission from dearer energy to other prices remains limited.
Important. This is general market analysis, not a personal recommendation to buy or sell. Historical data and company results do not guarantee future returns. Forecasts and conditional scenarios may not materialise.
How is the history preserved and updated?
All five periods in this edition share one information date. Week means the latest 7 days, quarter means 90 days, and year means the trailing 12 months. The next dated edition will have a separate URL. This text keeps its date and assessment; later events are not silently inserted into an older edition. Longer periods assess new evidence alongside earlier developments without repeating every headline.