
Quarter · Market review
Quarter: higher energy costs and technology expansion
On 14 October, US inflation accelerated; on 15 October, TSMC reported higher profit. Over 18 July–15 October, energy-supply disruption, trade decisions and technology investment changed costs through different channels. Current results show which businesses can offset those costs with revenue, but conditions are not the same for every company.
Period covered: 2026-07-18 – 2026-10-15Information as of 18 min read
US annual inflation rose from 3.4% to 3.7%. New ASML and TSMC results showed growing revenue in the semiconductor industry.
The Federal Reserve’s September target range of 3.75–4.00% remains in force. Its next decision is scheduled for 28 October.
Quarter
What happened
July and August: the supply recovery was not sustained
Before the period beginning on 18 July, the euro-area deposit rate had already been 2.25% from 17 June and the US target range was 3.50–3.75%. The European Central Bank left rates unchanged on 23 July, as did the Federal Reserve on 29 July. The US–Iran memorandum of 18 June was not proof of restored shipping; the International Energy Agency’s 10 July report already described ceasefire breaches on 7–8 July.
On 12 August, the agency reported July Persian Gulf oil exports, including routes bypassing the strait, averaging 15 million barrels a day. That was 2.1 million, or about 12%, below June, not a one-day shipping stoppage. On 5 and 8 September, US military command reported strikes on Iranian tankers; these were statements by a party to the conflict, not an independent measure of all flows.
On 23 July, the European Union’s 21st Russia-sanctions package expanded restrictions on energy, financial services and the shadow fleet. That day, the US Trade Representative announced tariff measures on imports from 60 economies, including the European Union, over insufficient bans on forced-labour goods. Particular tariffs and exemptions depended on the product and its origin.
Technology suppliers earned profits while customers paid for infrastructure
On 29 July, Microsoft reported 41 billion US dollars of capital investment including finance leases for the quarter ending 30 June; cash purchases of property and equipment were 35.8 billion. These amounts are not additive. Operating cash flow was 55.4 billion dollars, leaving 19.6 billion after cash asset purchases. On 26 August, NVIDIA reported 96.221 billion dollars of revenue for the quarter ending 26 July, up 106% year on year; operating profit rose 124%.
Euro-area second-quarter real growth was revised to 0.6% from the previous quarter on 7 September. US selected-service-sector second-quarter revenue growth was revised to 3.0% quarter on quarter on 9 September; this does not remove price effects.
On 9 September, the US Energy Information Administration raised its second-half average Brent forecast to about 90 US dollars a barrel. Model inputs closed on 3 September, so this was neither a measure of later military statements’ effects nor an exchange price. On 11 September, the International Energy Agency forecast a larger decline in this year’s oil supply than demand.
The US August Consumer Price Index published on 11 September showed annual growth of 3.4%, unchanged from July, but seasonally adjusted monthly growth accelerated from 0.1% to 0.4%. Excluding food and energy, annual growth slowed from 2.5% to 2.4%, while monthly growth rose from 0.2% to 0.3%.
Mid-September: interest rates rose while economic signals diverged
On 16 September, the Federal Reserve raised its target rate range to 3.75–4.00%, effective from 17 September. The European Central Bank’s 10 September decision to raise its deposit rate from 2.25% to 2.50% took effect on 16 September. On 18 September, the Bank of Japan set a 1.25% overnight rate target from 24 September, while the Bank of England left its rate at 3.75% on 17 September.
The US 10-year Treasury yield had fallen to 4.96% on 21–22 September but reached 5.18% on 24 September. On 23 September, the preliminary S&P Global US PMI Composite Output Index rose from August’s 56.0 to 58.4. The initial unemployment-claim count for the week ending 19 September, revised on 1 October, was 198 thousand; the week ending 26 September recorded 197 thousand. The earlier estimate for the first week had been 197 thousand.
On 25 September, US August durable-goods orders were 338.6 billion dollars, almost unchanged from revised July. Non-defence capital-goods orders excluding aircraft rose 1.6%, with shipments up 0.6%. However, the final University of Michigan September sentiment index fell from August’s 51.7 to 48.1. Monthly order changes remove seasonality, not price effects; claims are not the number of new jobs.
On 27 September, the White House published proposed US–China tariff-relief product lists, each covering roughly 30 billion US dollars in one trade direction. The US list included plastic tableware and bedding from China; China’s list included US beef and dairy products. The relief was not yet in force. On 28 September, China reported that larger industrial companies’ August profits rose 4.2% year on year, after July’s 11.2%; these are not changes between adjacent months.
30 September: spending held up while energy and technology demand increased
On 30 September, the US Bureau of Economic Analysis reported that real August spending rose 0.6% month on month while real disposable income was unchanged. The Personal Consumption Expenditures Price Index rose 3.4% year on year, or 3.0% excluding food and energy. July’s annual rates were the same in that revised data vintage. Second-quarter real gross domestic product growth was revised from a 1.5% to a 2.2% annualised rate, equivalent to 0.6% from the previous quarter.
Destatis’s preliminary German September figures published on 30 September showed faster price growth; the final estimate on 13 October confirmed this, as discussed below. France’s annual harmonised consumer-price inflation rose from 2.6% to 3.4%.
China’s manufacturing purchasing managers’ index rose from 49.8 to 50.1, but new orders fell from 50.6 to 50.5 while input purchase prices rose from 56.6 to 60.8.
On 30 September, the US Energy Information Administration reported 427.3 million barrels of commercial crude stocks for the week ending 25 September, 2.6% more than a year earlier. Gasoline stocks were 7.4% lower and distillates, including diesel and heating products, 14.9% lower. More crude was not the same as adequate finished-fuel stocks.
Memory-chip maker Micron reported 54.229 billion US dollars of revenue on 30 September for its quarter ending 3 September, versus 11.315 billion a year earlier. This year’s quarter lasted 14 weeks and the earlier one 13, so the comparison is not equal-length.
? Economic indicators: where do comparisons differ?
Real spending and gross domestic product growth remove price effects; a US annualised quarterly rate is not growth achieved in three months. Consumer-price and consumption-expenditure indices use different baskets and weights; the latter also covers some spending paid on consumers’ behalf. A purchasing managers’ index above 50 indicates broad expansion, not percentage growth of that size; a price index measures how widespread increases are.
1–7 October: fewer new jobs and higher costs
On 1 October, the US Institute for Supply Management’s September manufacturing purchasing managers’ index was 54.5, while prices paid rose from 71.1 to 77.9. The European Central Bank reported August new-mortgage rates of 3.60%, consumer-credit rates of 7.92%, and an almost unchanged corporate borrowing-cost measure of 3.77%. These are euro-area averages for new agreements and do not yet capture September’s rate increase.
On 1 October, Eurostat reported second-quarter Lithuanian housing transaction prices 14.3% higher year on year, versus 4.0% in the euro area. These are prices, not rental income or net investment returns.
On 2 October, the US Bureau of Labor Statistics reported 29 thousand additional non-farm jobs in September after revised August growth of 133 thousand. The combined July–August result was reduced by 60 thousand; July became a loss of 10 thousand jobs. September unemployment was 4.2%. Eurostat’s preliminary estimate that day showed euro-area September consumer inflation rising from 3.2% to 3.8%. On 4 October, seven OPEC+ countries kept September output targets for November, not confirmed actual supply.
On 5 October, the Nasdaq Composite price index rose 1.05% in US dollars from the 2 October close, while the US 10-year Treasury yield rose from 5.28% to 5.31%. The September ISM Services PMI published that day fell from 55.4 to 54.9, while prices rose from 72.6 to 74.0.
On 5 October, Eurostat reported euro-area August industrial producer prices up 1.9% from July: energy rose 5.6%, and industry excluding energy 0.2%. These are domestic-market selling prices, not all production costs or consumer inflation. European Central Bank Executive Board member Philip Lane said that day that dearer energy left families less money for other goods and higher long-term interest rates restrained spending and investment; this was his assessment, not a new decision.
On 6 October, Destatis reported German August factory orders down 10.6% from July, or 0.1% excluding large orders. Ships, aircraft, trains and military vehicles had exceptionally large July orders. Nevertheless, June–August orders excluding large deals were 2.6% below the preceding three months. Orders are not realised revenue; the measure removes price, seasonal and calendar effects, and August figures are preliminary.
For your investments
Let’s discuss your portfolio
 FINANCIAL FREEDOM01 / 04
Investment results since 1999
Are you beating
global equities?

at the end of the period
Jan 1999–Jun 2026 · EUR · Cumulative return, %
Linear scale · * MSCI World → MSCI ACWI.
Past performance does not guarantee future returns.
FINANCIAL FREEDOM02 / 04Historical comparison
How far did it fall?
How long to recover?
Decline from the previous high

Longest recovery to the previous high

Jan 1999–Jun 2026 · EUR · Monthly data
* MSCI World → MSCI ACWI.
Past performance does not guarantee future returns.
FINANCIAL FREEDOM03 / 04Personal investment consultation
Already investing?
Let’s review your portfolio.
Yet to start
investing?
Let’s build your first
investment plan.
FINANCIAL FREEDOM04 / 04
Personal investment
consultation
Martynas
Juška
Investment manager
Managing a portfolio
of more than€100 million
The Federal Reserve’s 15–16 September minutes, published on 7 October, showed most participants then expecting another rate increase; this was not a new October decision. The US Treasury’s 39 billion dollar reopening of a 10-year bond that day had a 5.30% high yield and a 2.77 bid-to-cover ratio.
8–9 October: borrowing remained expensive and demand was uneven
On 8 October, Federal Reserve Governor Christopher Waller left another rate increase open if the data developed as he expected. The European Central Bank’s September meeting account, published that day, recalled that energy costs had not yet spread broadly into wages and other prices. This described an earlier meeting, not a new decision.
At the US Treasury’s 22 billion US dollar reopening of a 30-year bond on 8 October, the high yield was 5.618%, versus 5.308% at the same issue’s 10 September auction. On 9 October, reference 2-, 10- and 30-year yields were 4.80%, 5.24% and 5.60%. The first two rose from the previous day’s 4.75% and 5.22%, while the third was unchanged. From 2 October they nevertheless fell by 3, 4 and 3 basis points respectively.
? Bond yields: what is being compared?
An auction high yield describes one issue; reference yields are derived from constant-maturity US Treasury quotations. Neither is a realised fund return; one basis point equals 0.01 percentage point.
On 8 October, Destatis reported that German August exports fell 0.8% from July to 137.6 billion euros, while imports rose 0.9% to 118.1 billion euros. The goods trade surplus fell from 21.6 to 19.5 billion euros. Exports to the US fell 6.3%, while sales to the euro area rose 0.8%, China 4.7% and the UK 16.7%. US sales were still 22.6% higher than a year earlier. These are seasonally and calendar-adjusted euro values, not physical volumes; the breakdown alone does not establish a tariff effect.
On 8 October, the European Systemic Risk Board’s assessment of its 1 October meeting warned of higher financial-stability risks, technology companies’ borrowing and excessive future-profit expectations. Leveraged funds could amplify bond volatility. Counterweights were European banks’ strong capital, liquidity and profitability and lower technology-financing concentration than in the US. This was a risk scenario, not a report of actual insolvency.
The University of Michigan’s preliminary 9 October survey showed US consumer sentiment falling from September’s 48.1 to 46.3. Current conditions fell from 50.9 to 44.7, but expectations rose from 46.3 to 47.3. The university highlighted expensive goods and borrowing that made large purchases harder. Median expected inflation for the coming year rose from 4.6% to 4.7%.
? Consumer surveys: what do they show?
The survey measures attitudes, not actual spending or a central-bank forecast. The median is the middle response: half expect no higher inflation and half no lower inflation; October’s figures are preliminary.
On 9 October, Destatis reported 2,373 German business insolvency cases in July, 8.0% more than a year earlier. From January to July, transport and storage recorded 85.5 cases per 10,000 businesses, versus 42.8 across the economy. However, creditors’ claims over those seven months fell from 31.8 to 21.9 billion euros: more economically significant businesses had failed a year earlier.
? Insolvency frequency: what does it measure?
It counts cases registered by courts per 10,000 businesses, not the default probability of one bond. Cases enter the statistics after the first court decision, often after about three months; creditors’ claims are not realised losses, and businesses closing for other reasons are excluded.
9–13 October: fuel, interest-rate and technology costs persisted
On 9 October, the US Treasury’s Office of Foreign Assets Control issued General License 135. Under the specified US rules it permits transactions involving the sale, delivery, offloading and import of Russian-origin diesel, including US imports, until 7 April 2027 at 00:01 Eastern Daylight Time (EDT). It does not permit debits from accounts of Russia’s central bank, National Wealth Fund or Finance Ministry at US financial institutions. This does not remove all sanctions: the licence neither changes other countries’ rules nor sets a delivery volume or schedule.
On 11 October, the International Energy Agency identified renewed attacks on Saudi civilian and energy infrastructure and asked countries to consider an additional diesel-stock release. No new quantity had been agreed. On 7 October, countries had already agreed to accelerate the uncompleted remainder of March’s stock programme, prioritising diesel; that was an earlier commitment, not an additional quantity.
On 12 October, Cleveland Federal Reserve President Beth Hammack said demand-restraining interest rates were still needed to bring inflation down. She highlighted energy, tariff-related import costs and demand for artificial-intelligence equipment that was raising the price of components used elsewhere. This was her personal assessment, not a Federal Reserve decision.
The Reserve Bank of Australia’s minutes published on 13 October explained the unanimous 0.25 percentage-point rate rise to 4.60% at its 28–29 September meeting. The bank discussed energy disruptions, constrained production capacity and artificial-intelligence equipment costs. Strong profits and resilient borrowers and banks were, for now, counterweights to rising technology debt and optimistic profit expectations. The minutes were not a new rate rise on 13 October.
The Bank of Japan’s preliminary September Corporate Goods Price Index, published on 13 October, showed annual growth of 6.8% after August’s 7.6%, and a 0.3% monthly decline. Import prices fell 0.2% from August in yen but rose 1.0% in contract currencies. Petroleum, coal and natural gas became 2.3% more expensive in contract currencies and contributed 0.69 percentage point to overall import-price growth.
? Japanese price indices: why does currency matter?
The producer index measures goods traded between businesses, not consumer prices or all production costs. Converting imports into yen changes the comparison; annual and monthly changes have different bases, and preliminary figures may be revised.
On 12 October, chip designer NVIDIA and networking supplier Cisco presented a plan for denser optical connections. Against 200-gigabit-per-second-per-lane modules, their design envisages four times the bandwidth density and about 1.3 times the energy efficiency. NVIDIA also contributed some rack and computing-module designs to the open-standards community. Processor designer AMD presented the open Helion rack design for AI agents that execute tasks; it planned November 2026 availability for equipment still being developed with partners.
? Equipment efficiency: what is the comparison’s limit?
A gigabit is one billion bits. The vendors’ comparison describes particular connections, not a whole data centre’s electricity bill or profit; an open design and planned availability are not realised sales revenue.
The European Central Bank’s 12 October reference rate was 1.1181 US dollars per euro, after 1.1206 on 9 October. The euro weakened by about 0.22% between those reference points. The rate was published before Beth Hammack’s speech, so this comparison neither establishes a reaction to her remarks nor represents a transaction price.
13 October: a better growth forecast and higher energy costs
On 13 October, the International Monetary Fund raised its 2026 global real-growth forecast from July’s 3.0% to 3.1%. Its 3.4% assessment for next year was unchanged. This is projected economic activity, not an achieved full-year result or an investment return. Technology investment supports demand, while energy-importing countries face higher costs.
That day, Germany’s statistical office confirmed September annual consumer-price inflation of 3.3%, after August’s 2.9%. Growth excluding food and energy remained 2.4%, while energy prices were 14.9% higher than a year earlier. The fuel-tax reduction from 1 October was not yet reflected in September’s measurement. These are German figures, not a reading for the entire euro area.
On 13 October, US bank JPMorganChase reported 6% higher third-quarter net profit. Net interest income rose 13% and operating expenses 12%, while provisions for credit losses fell from roughly 3.4 to 2.7 billion US dollars. One bank does not describe the entire sector: profit depends on expenses and provision estimates as well as demand for loans.
US shoppers have less purchasing power for other spending
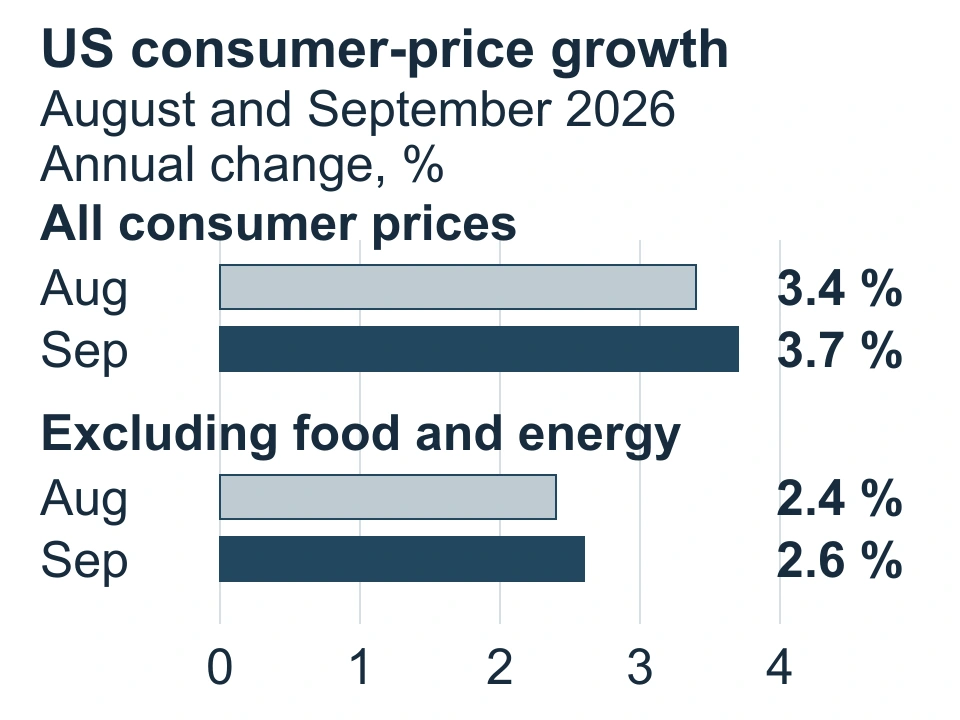
On 14 October, the US Bureau of Labor Statistics reported that September consumer prices were 3.7% higher than a year earlier. Annual growth had been 3.4% in August. Excluding food and energy, the increase also accelerated, from 2.4% to 2.6%.
? Consumer Price Index: what does it measure?
The Consumer Price Index measures changes in the price of an average basket of goods and services. The annual comparison with the same month a year earlier is not seasonally adjusted, while the monthly changes quoted here are adjusted. Excluding food and energy helps examine other prices but does not describe a household’s entire bill.
Petrol delivered the largest monthly shock. It became 9.1% more expensive in September and accounted for more than half of the overall monthly price increase. The full basket rose 0.6% from August, while monthly growth excluding food and energy remained 0.3%. Annual inflation therefore accelerated even though monthly growth in the basket excluding food and energy did not accelerate.
Pay figures published the same day showed the practical consequence. Average hourly earnings in US private nonfarm jobs rose 0.1% in September, but their purchasing power fell 0.5% after adjusting for prices. That can constrain discretionary spending: a larger share of pay is needed for the same fuel and everyday expenses.
? Purchasing power of pay: whose change is measured?
This is the change in average hourly earnings adjusted for consumer prices; the monthly figures are seasonally adjusted. It is not every individual’s pay, and the August and September earnings estimates remain preliminary.
Oil supply recovers while fuel constraints remain
On 14 October, the International Energy Agency estimated that global oil supply rose by 2.5 million barrels a day in September to 102.3 million. That was roughly 2.5% more than in August. Delivering crude and turning it into the required fuel are different steps, however, and diesel supply remains constrained.
The agency also forecasts lower oil demand for 2026 as a whole. That is not solely good news for buyers: consumption can also decline because households and businesses cut spending. Transport companies and agriculture need diesel to reach them on time, while oil producers also depend on the volume they can sell.
The chip industry grows, but not every profit measure improves
On 15 October, Taiwan’s TSMC, which manufactures chips designed by other companies, reported its third-quarter results. Revenue in Taiwan dollars rose 50.9% year on year and net profit increased 68.7%. In US dollars, TSMC’s sales grew 41.2%: translating into another currency changes the reported growth rate.
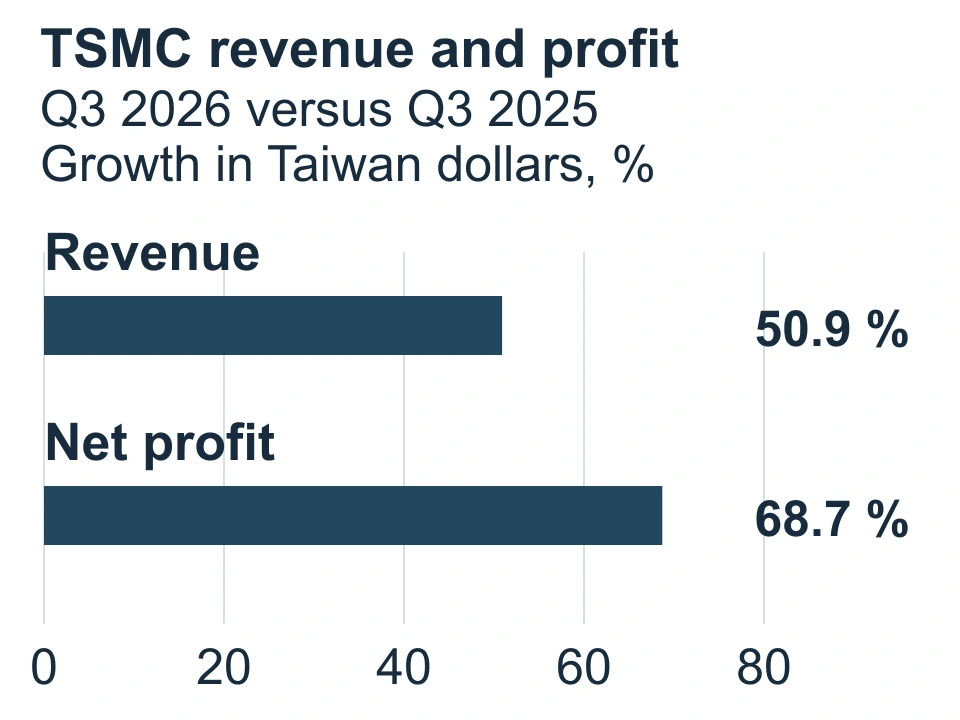
TSMC’s gross profit margin nevertheless fell from 67.7% in the second quarter to 66.4% in the third. Rapid sales growth does not automatically mean that each dollar of revenue produces more gross profit. The margin was 59.5% a year earlier, so the annual and quarterly comparisons tell different stories.
? Gross profit margin: what does it show?
It is the share of revenue left after the cost of producing the goods sold. It excludes some operating expenses, taxes and investment, so it is not a measure of net profit or available cash.
On 14 October, Dutch chipmaking-equipment supplier ASML reported quarterly sales of 11.66 billion euros, around 55% higher than a year earlier. Sales of both equipment and chips point to strong demand across this industry. However, ASML’s 4.96 billion euros of net profit included about 0.51 billion euros of gains on an equity investment; the entire increase cannot be attributed to equipment sales.
Quarter
What matters now
More expensive fuel first reduces the amount households can spend elsewhere. That creates risks for discretionary retailers and consumer lenders. Everyday-goods businesses may prove more resilient, but they too must judge how much of their higher delivery costs customers will accept. Today’s retail-sales release will help test whether the squeeze is already visible in sales.
The bond market did not move in a single direction after the US price release. On 14 October, the reference 2-year US Treasury yield rose from the previous day’s 4.79% to 4.82%, while the 10-year yield fell from 5.21% to 5.19%. Persistent inflation makes rate cuts harder, but longer-dated bonds also depend on expectations for future growth.
Technology investment provides a counterweight to weaker household purchasing power. Chip and equipment suppliers receive orders, but their customers need costly equipment to generate enough money later. Chipmaker shares and the bonds of companies financing data centres are therefore different exposures. Growing revenue creates an opportunity; the main risk arises when expansion and debt increase faster than cash generated by operations.
Europe’s energy-importing industries need reliable supply, while exporters need clear trade rules. A ceasefire plan or legal exemption is not a delivered cargo. Energy producers’ revenue also depends on the quantity they sell, so a higher price alone does not establish a larger profit.
Quarter
What comes next
15 October, 15:30 Lithuanian time: US September retail sales and producer prices. The former will show the value of sales; the latter will test whether price pressure is also visible among producers. Any sales increase must be assessed alongside inflation, as sales dollars are not the quantity of goods sold.
16 October, 15:30: US September import and export prices. They will help assess how much cost pressure is coming through international trade.
27–28 October: the Federal Reserve meeting. The question is whether faster inflation outweighs the risk of weaker demand and requires another change in interest rates.
Important. This is general market analysis, not a personal recommendation to buy or sell. Historical data and company results do not guarantee future returns. Forecasts and conditional scenarios may not materialise.
How is the history preserved and updated?
All five periods in this edition share one information date. Week means the latest 7 days, quarter means 90 days, and year means the trailing 12 months. The next dated edition will have a separate URL. This text keeps its date and assessment; later events are not silently inserted into an older edition. Longer periods assess new evidence alongside earlier developments without repeating every headline.