
Weekly market review · 9–13 November 2026
US stocks rose, but markets expected higher interest rates
US stocks recovered in the week of 9–13 November, while government bond yields rose. The week’s inflation figures showed why that distinction matters: energy prices rose more slowly, but prices of other goods and services kept climbing. Company profits still depend not only on customer demand, but also on borrowing costs.
The week at a glance
What moved markets before the detailed explanation
US stocks rose over the week even as Treasury yields climbed. Inflation, the largest companies’ weight in funds and uneven economic growth explain where risks remain.
- US S&P 500+2.51%6–13 November closes; USD price index, excluding dividends.
- US 10-year Treasury yield5.15%13 November, versus 4.86% on 6 November; not a weekly return.
- US consumer prices+0.4%October versus September, seasonally adjusted; September +0.6%.
- Probability of a larger US rate increase11.5%13 November: a 0.50-point increase on 9 December; CME FedWatch.
- Euro area real GDP+0.4%Q3 versus Q2, seasonally adjusted; employment was unchanged.
What changed this week
US stocks recovered from earlier losses at the start of the week, before giving back some of their gains. Indices rose on Monday, 9 November. Tuesday’s inflation report showed that consumer prices were still climbing. Stocks slipped that day, while US government bond yields increased. A positive weekly change in share prices therefore masks a less even path through the week.
US stocks reached their highest closing levels of the week on Wednesday. On Thursday, chipmaker NVIDIA announced that its board had accepted its chief executive’s resignation the previous day. Technology investors faced a new question about the continuity of the company’s plans. The main US share indices fell on Thursday and Friday, but still finished the week higher.
Friday’s figures helped explain why one piece of good news is not enough. US producers’ selling prices rose more slowly than in September, but they were still rising. In the euro area, output of goods and services expanded even though employment stopped growing. For consumers, the question is whether incomes will outpace prices. For businesses, it is whether higher sales will cover wages, materials and interest costs.
Three questions therefore matter most: is inflation easing beyond energy, how much does a broad equity fund depend on a few large companies, and where is customer demand genuinely strengthening? Oil deliveries and the dollar add to this picture because they affect some of European companies’ costs.
Prices rose more slowly, but markets expected higher US rates
On 10 November, the US Bureau of Labor Statistics reported that consumer prices rose 0.4% in October from the previous month, compared with 0.6% in September. That is good news about the pace of price increases, not the price level itself: the average shopping basket still became more expensive.
A closer look shows that the improvement was uneven. The monthly jump in energy prices slowed from 5.2% to 0.7%. But rose at the same pace in August, September and October: 0.3% each month. This comparison helps distinguish a month’s energy price movements from broader inflation.
The cost of the basket is compared with the previous month, after adjusting for normal seasonal patterns. Food and energy are separated out because their prices can fluctuate sharply, not because these costs do not matter to households. The bureau does not publish October’s annual change for most series because October 2025 data are missing.
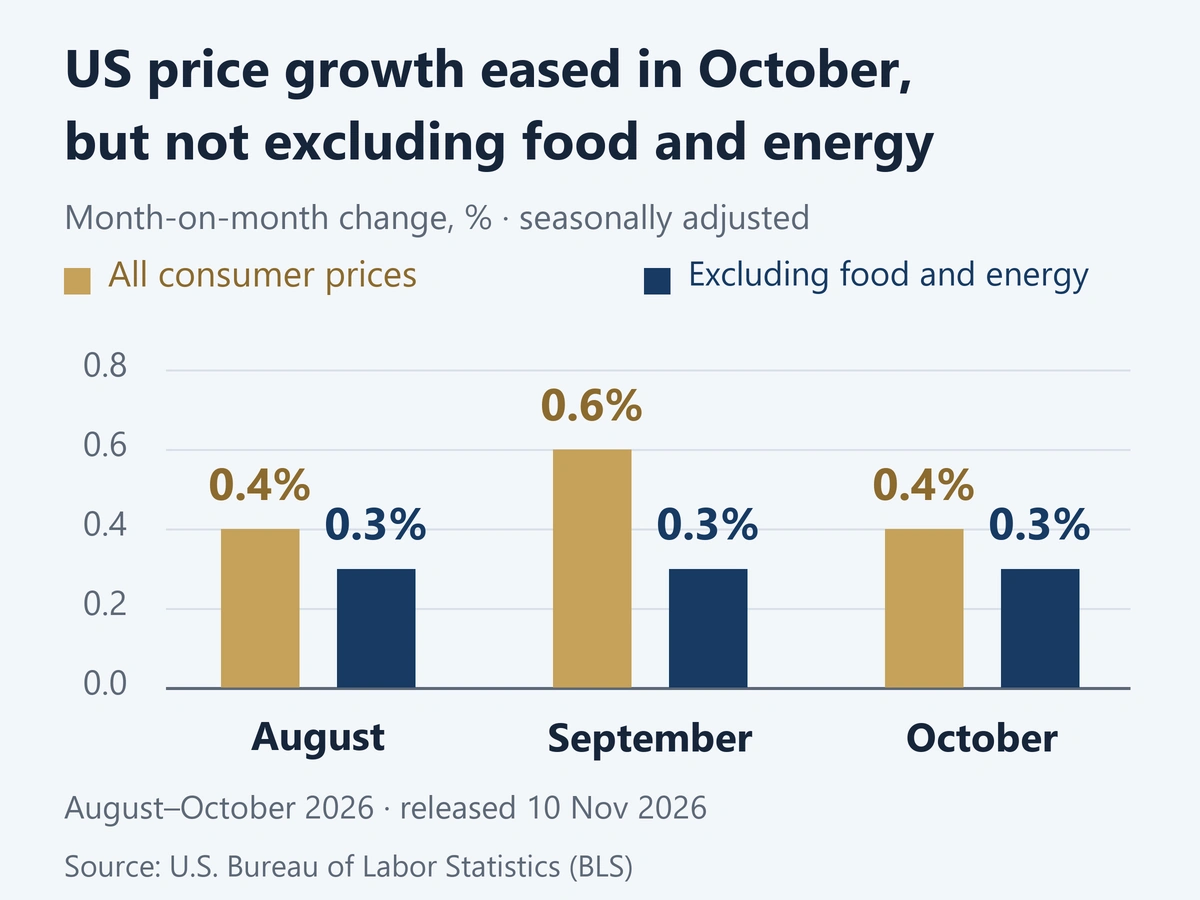
Bond investors need to consider whether rising prices will continue to erode the purchasing power of future interest payments. Slower energy price increases alone are not enough to expect rapid interest-rate cuts if other prices keep rising at a similar pace. Producer figures released on 13 November also showed an increase: selling prices rose 0.3% in October, after 1.4% in September. These are the prices producers receive, not the costs they pay.
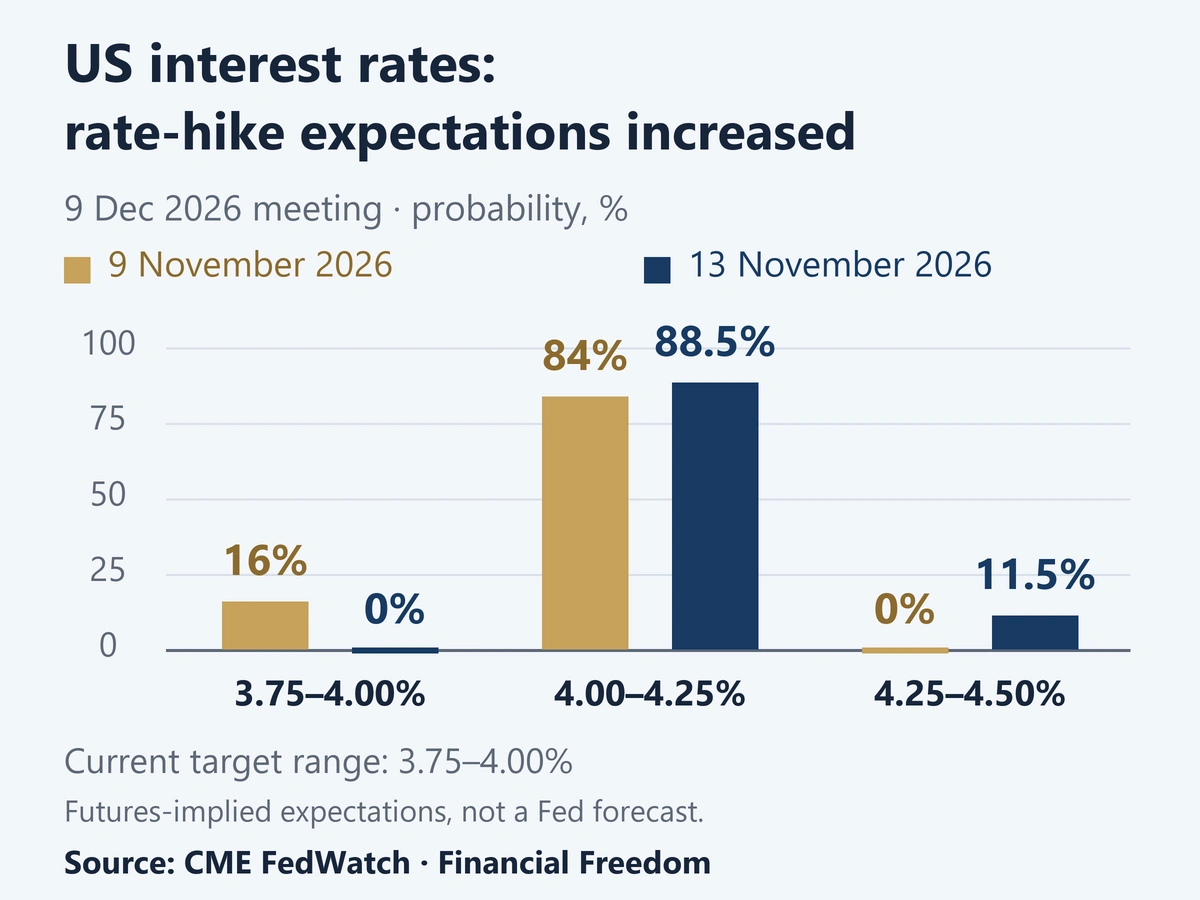
also shifted during the week. On 9 November, CME FedWatch put the probability of the Federal Reserve leaving US rates unchanged on 9 December at 16%. By 13 November, it had rounded to 0%. A 0.25-percentage-point increase remained the main scenario, but a larger, 0.50-point increase had also become a possibility.
CME FedWatch derives probabilities from 30-day federal funds futures prices: these are market expectations, not a Federal Reserve forecast or promise. A 0.25-percentage-point increase would raise the target range from 3.75–4.00% to 4.00–4.25%. The comparison covers the full week, not just the inflation release; 0% or 100% is not a guarantee.
For your investments
Let’s discuss your portfolio
 FINANCIAL FREEDOM01 / 04
Investment results since 1999
Are you beating
global equities?

at the end of the period
Jan 1999–Jun 2026 · EUR · Cumulative return, %
Linear scale · * MSCI World → MSCI ACWI.
Past performance does not guarantee future returns.
FINANCIAL FREEDOM02 / 04Historical comparison
How far did it fall?
How long to recover?
Decline from the previous high

Longest recovery to the previous high

Jan 1999–Jun 2026 · EUR · Monthly data
* MSCI World → MSCI ACWI.
Past performance does not guarantee future returns.
FINANCIAL FREEDOM03 / 04Personal investment consultation
Already investing?
Let’s review your portfolio.
Yet to start
investing?
Let’s build your first
investment plan.
FINANCIAL FREEDOM04 / 04
Personal investment
consultation
Martynas
Juška
Investment manager
Managing a portfolio
of more than€100 million
Higher bond yields offer an opportunity to buyers but raise borrowing costs
US government bond rose over the week at both short and long maturities. The two-year yield increased from 4.51% to 4.88%, and the ten-year yield from 4.86% to 5.15%. These figures provide a reference point for the cost of other dollar borrowing, but are not loan offers to a particular person or business.
A bond’s yield links the price paid today with its future interest payments and repayment at maturity. These are annualised market measures calculated by the US Treasury, not an investment’s weekly return. When new bonds offer more, existing fixed-rate bonds generally fall in price.
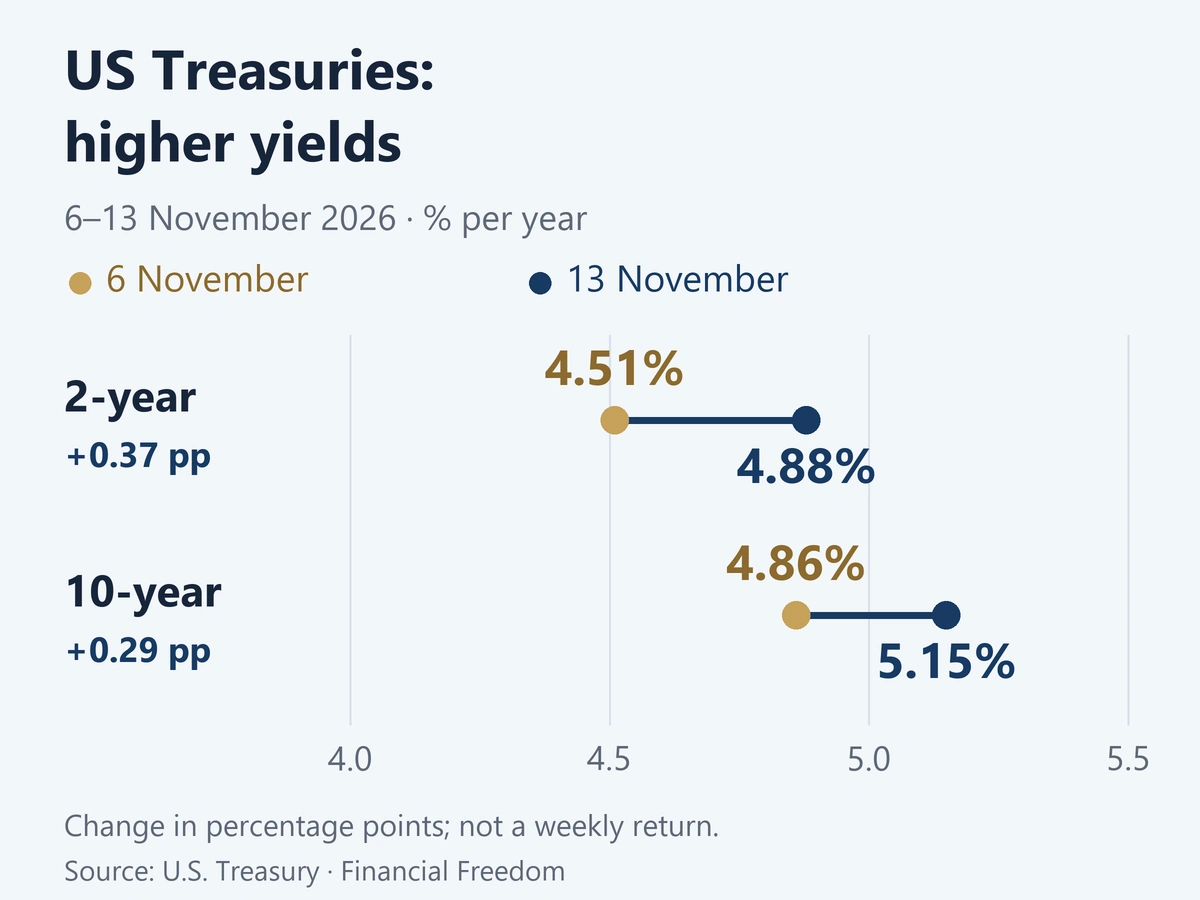
For companies, this matters when they need a new loan or an existing one reaches the end of its term. More money spent on interest leaves less for investment and shareholders, even if sales do not fall. Payments on an existing fixed-rate loan do not change automatically. Shares are affected differently: when bonds offer more, investors may require stronger evidence of profit growth before agreeing to pay the same share price.
A broad fund does not necessarily spread risk evenly
The broad US S&P 500 index rose 2.51% over the week, while the technology-heavy Nasdaq Composite gained 2.27%. These are between the closing levels on 6 and 13 November, measured in US dollars. They do not mean that every constituent company rose by a similar amount.
A price index tracks share price changes, excluding dividends. Companies with a larger market value generally have more influence on the S&P 500, so it is not an average with equal amounts invested in every share. A fund investor’s return is also affected by fees and exchange rates, unless currency exposure is hedged.
According to J.P. Morgan’s data for 30 September, the ten largest S&P 500 companies accounted for 40.6% of the index’s market value. A simple illustration puts that in perspective: if a €100 investment exactly matched the index’s composition on that date, about €40.60 would be invested in those ten companies. This is background from the previous quarter, not a new measurement from this week.
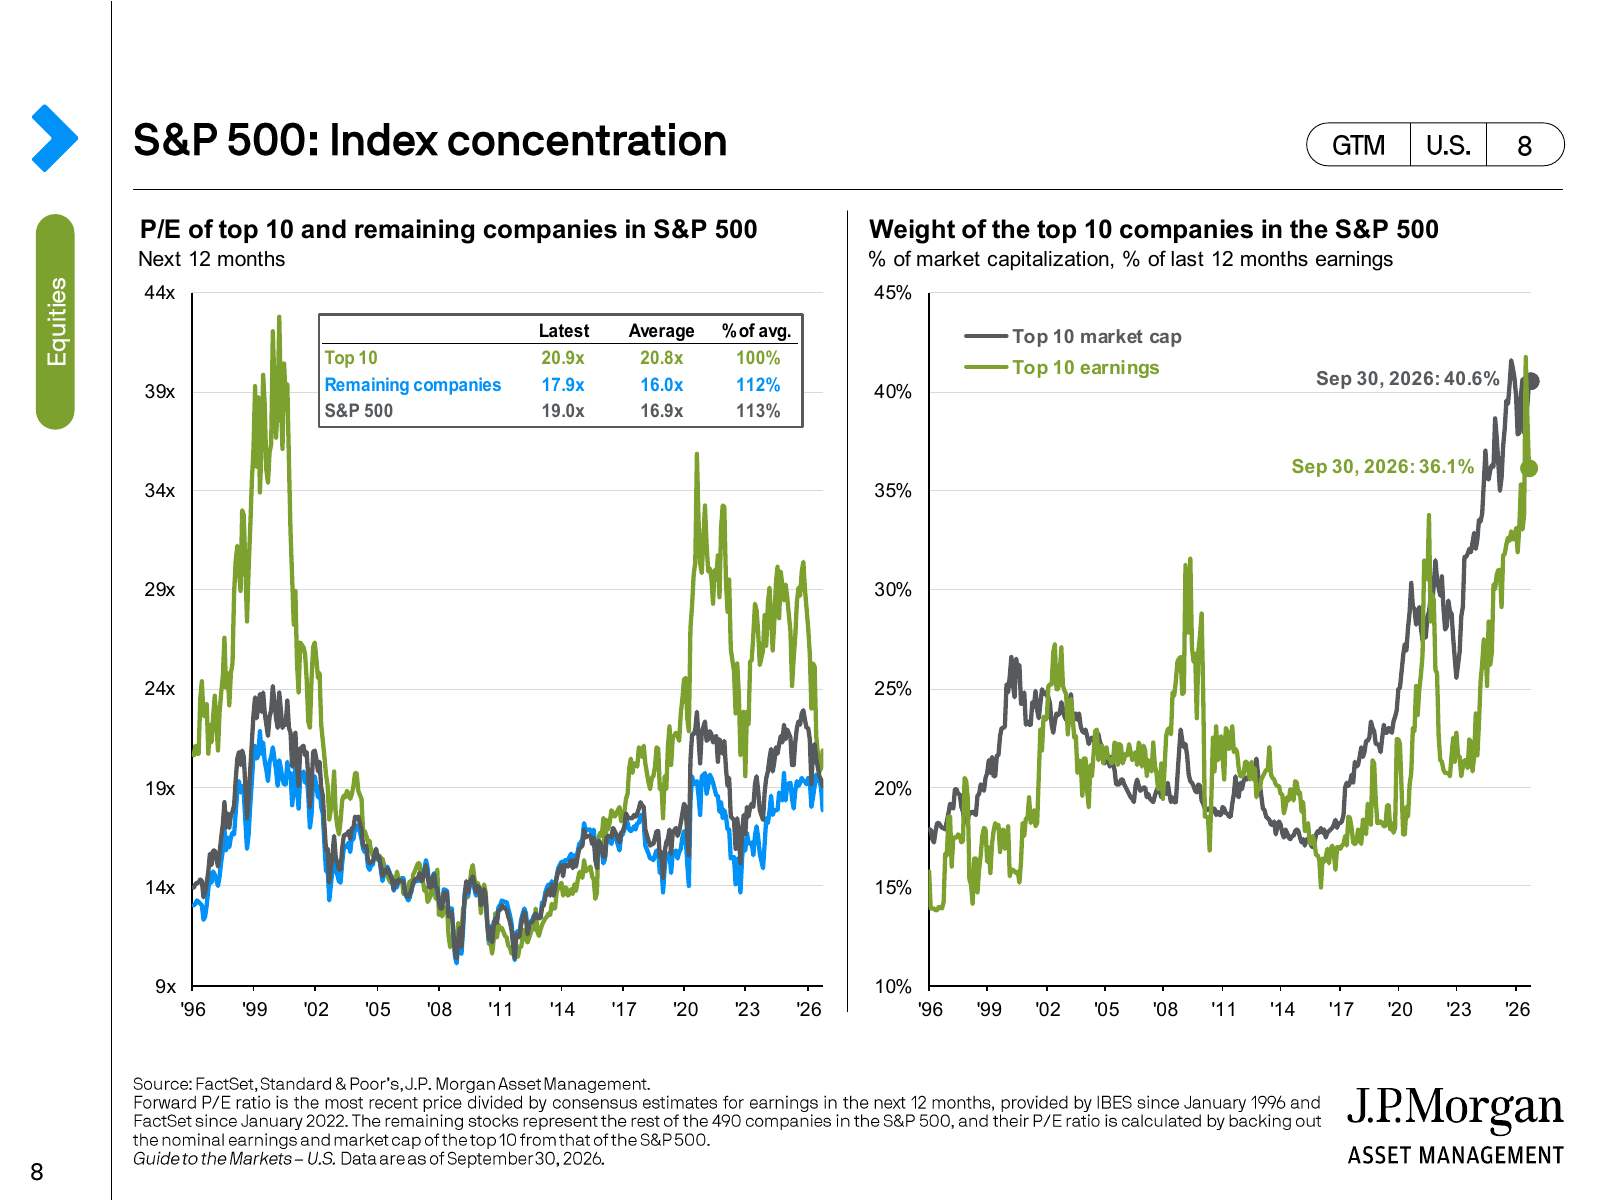
That weight works both ways. Rapid profit growth at a few large companies can support the whole index. Disappointing orders or plans can also affect an investor who has not bought any of those shares directly.
When reviewing funds, it is worth comparing their largest holdings, not just their names. A technology fund and a broad US equity fund may own many of the same shares. Holding both may therefore reduce dependence on the largest companies less than it first appears.
US growth accelerated as the euro area slowed
Third-quarter figures show the major economies moving in different directions. US real gross domestic product, the volume of goods and services produced after allowing for price changes, grew by about 0.8%, following 0.5% in the second quarter. In the euro area, growth slowed from 0.6% to 0.4%. Both comparisons are between consecutive quarters and adjusted for seasonal patterns. The US figures were published on 29 October and the updated euro area estimate on 13 November.
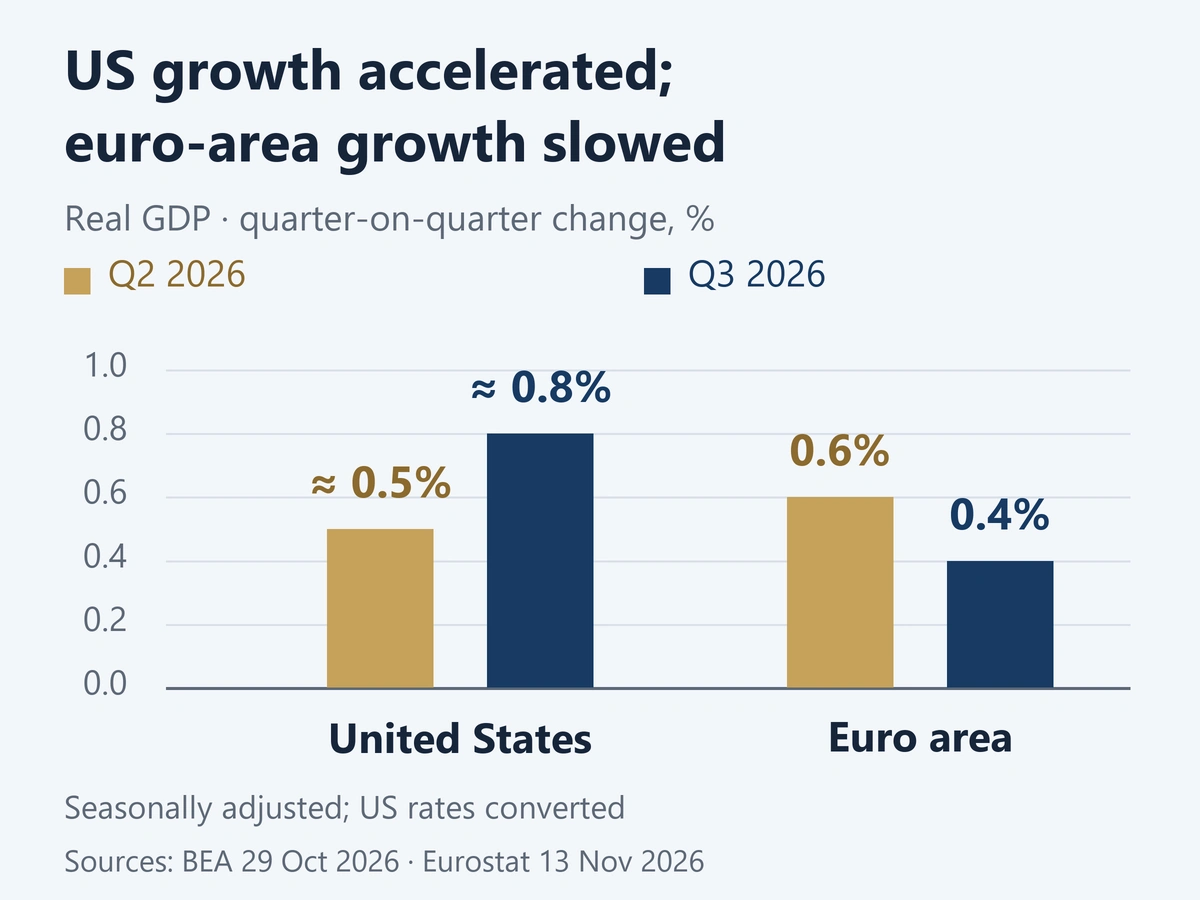
The euro area’s growth estimate was unchanged from 30 October. The new finding this week was that employment had stopped growing in the third quarter, after rising 0.1% in the second. A stable number of workers is not the same as falling household incomes: wages or hours worked may increase. If wages outpace prices, families can buy more even without an increase in employment.
This distinction helps when assessing European shares. For a local retailer or service provider, household purchasing power matters most. An exporter may depend more on orders from US customers, even if the company itself is based in Europe. A fund’s geographical label therefore does not tell us where its companies earn their revenue. Stronger foreign demand may help exporters, but it cannot replace domestic spending for every European business.
Oil stocks are growing, but their location matters
On 13 November, the International Energy Agency reported that observed global oil inventories rose by 52 million barrels in October. Oil at sea increased by 86 million barrels, while onshore stocks remained at their lowest level since at least 2016. An increase in total stocks does not therefore mean refineries can quickly obtain the oil they need.
The distinction is straightforward: oil on a tanker still has to reach a port and a refinery. If deliveries speed up, greater supply could reduce fuel prices and the costs of transport companies and manufacturers. But longer routes or delivery disruptions can leave local shortages even as global stocks rise. For oil producers, cheaper crude would mean lower sales revenue for the same volume.
European buyers face another variable: the dollar. The ECB’s reference exchange rate moved from 1.1165 to 1.1052 dollars per euro between 6 and 13 November. A simple currency conversion illustrates the effect: the same US$100 product, with its dollar price unchanged, would have become more expensive in euros, rising from about €89.57 to €90.48. This excludes currency conversion fees.
Even a fall in a commodity’s dollar price therefore does not necessarily reduce a European company’s bill by the same amount. The exchange-rate effect works the other way for someone holding dollar investments: their value in euros rises, unless the investment is hedged against currency movements. That is why it helps to assess commodity prices and currencies together.
What could change the picture next week
- 17 November: US retail sales and industrial production. Are customer demand and output holding up while new loans remain expensive? These figures will help assess the outlook for company revenues.
- 17 November: NVIDIA results. Have orders and product plans changed? Given the weight of the largest technology companies, the answer matters beyond holders of a single share.
- 18 November: minutes of the Federal Reserve’s October meeting. Which price and economic developments mattered most to the US central bank? This explains an earlier meeting; it is not a new interest-rate decision.
The week’s stock market gains were real, but they did not remove higher interest rates or uneven economic growth. When assessing a portfolio, it helps to consider what company profits depend on: customer spending, refinancing loans or a few large technology businesses. These differences explain more than the overall weekly percentage change alone.
Important. This is general information, not a personal investment recommendation. Investments can fall in value; past performance does not guarantee future returns.