
Today · Market review
The Fed raised rates as spending and input costs climbed
The Federal Reserve raised interest rates yesterday. Data released the same day show why investors cannot stop at that one number: households spent more, imported goods became dearer, and fuel inventories were uneven. This morning’s question is which businesses can turn stronger demand into profit after paying more for borrowing and inputs.
Period covered: 2026-09-17Information as of 6 min read
The key development since yesterday is the Federal Reserve’s completed decision. It raised its target range by 0.25 percentage points to 3.75–4.00%, effective today. Policymakers also published higher projections for future rates, while official August retail and import-price figures and weekly petroleum-stock data became available. These releases were published yesterday, not this morning.
The week’s underlying question remains whether growth in sales and corporate revenue can withstand higher borrowing, energy and import costs. A strong nominal sales month does not prove that more goods were sold or that profits improved. One week of fuel inventories is not a measure of the entire world oil market.
Today
What happened
The Fed raised rates yesterday, and its projections moved higher
Yesterday’s most consequential market decision was a quarter-percentage-point increase in the Federal Reserve’s federal funds target range to 3.75–4.00%, effective 17 September. All twelve voting members supported it. That is a completed decision, not a market forecast. Policymakers’ separate year-end projections also changed. Their median for the end of 2026 is now 4.1%, compared with 3.8% in June; for the end of 2027, it is 4.1%, compared with 3.6%. These figures express individual policymakers’ views, not a promised schedule of future decisions.
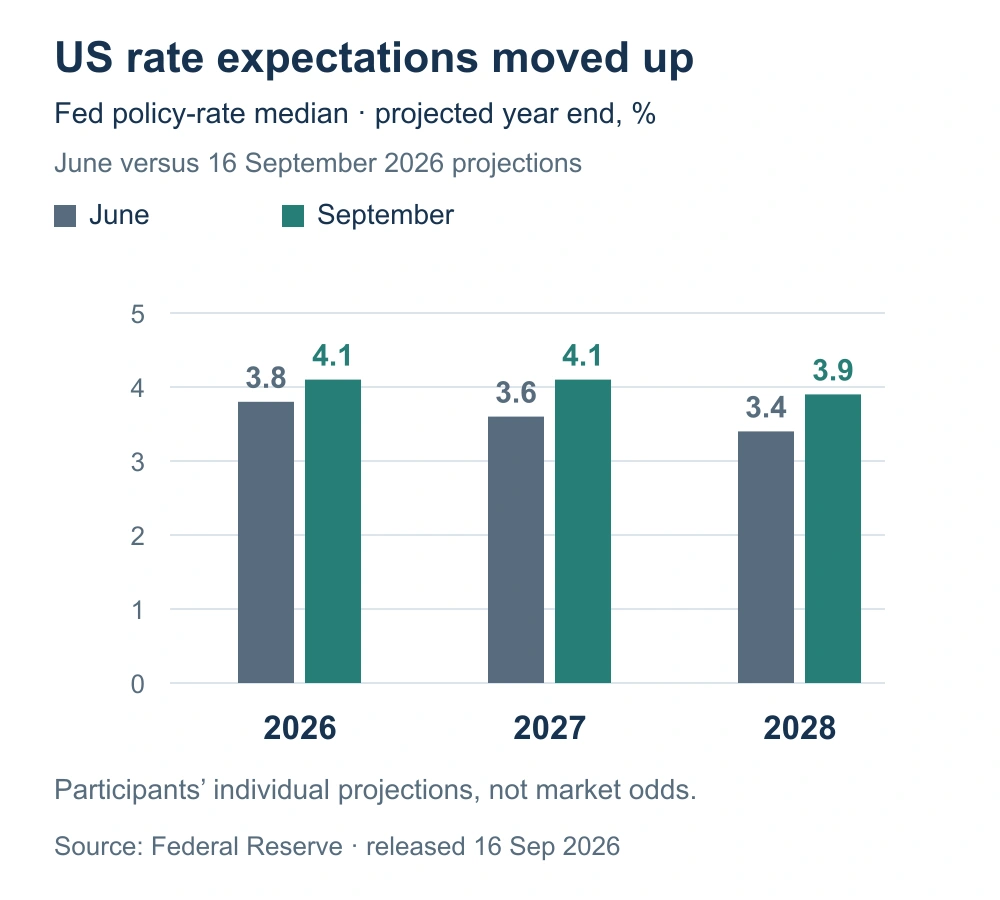
If rates stay higher for longer, a company taking out a new loan pays more for it. Higher yields on new bonds can weigh on the market value of older fixed-rate bonds. Pressure is greatest for businesses spending today in hopes of profits years away; firms already generating enough cash to fund expansion have a cushion. For a euro-based investor, the dollar’s exchange rate can change the final return even if the US asset performs as expected.
? Rate projection: is this the probability of the next move?
No. The figures are the median of Federal Reserve officials’ individual year-end forecasts. The market-implied probability of a move at the next meeting is a different measure derived from futures prices. We do not publish a numerical probability until its latest value can be checked directly.
Yesterday’s US data showed sales and import costs rising together
Stronger store revenue does not remove inflation risk. The US Census Bureau reported yesterday that retail and food-services sales were $773.9 billion in August, up 1.2% from the previous month. These are nominal dollars, not sales adjusted for inflation, so they do not by themselves establish how many more goods were bought. Separately, the Bureau of Labor Statistics reported that import prices rose 0.7% on the month and 7.0% from a year earlier. Import prices measure goods entering the country, not the final bill at the checkout.
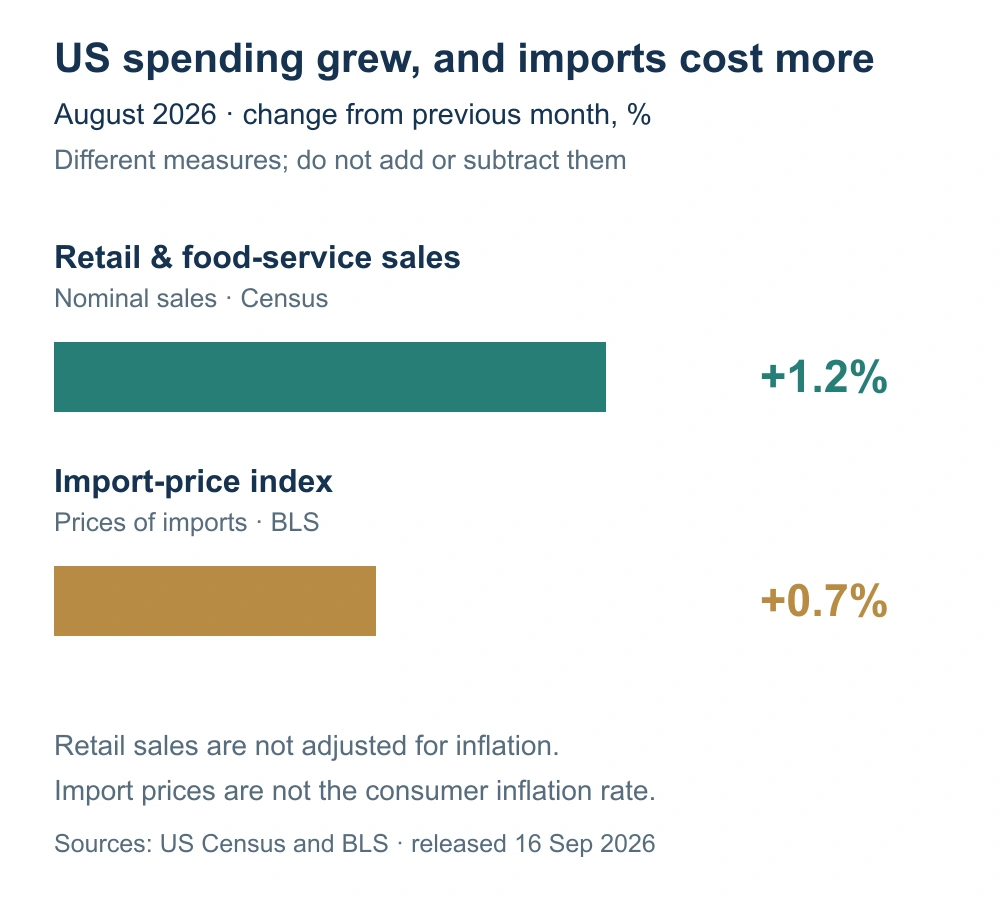
A retailer can sell more yet earn less per sale if suppliers charge more and customers resist a full price increase. For shops and manufacturers reliant on imported inputs, profit margin matters more than revenue alone. Transport firms and suppliers might benefit from stronger volumes, provided their own costs do not overtake them. Investors face two different risks: robust demand could sustain price pressure and high rates, while weaker real purchasing power could later reduce the volume sold. The next test will be consumer-price data and companies’ reported margins.
? Nominal sales: does the figure mean more goods were bought?
Not necessarily. Nominal retail sales add up the dollars customers spent. The total can rise because prices increased, quantities increased or both. A comparison of real volumes requires an appropriate price adjustment and a look at the mix of goods sold.
Yesterday’s oil report showed why crude stocks are only part of the story
US inventories sent mixed signals for the week ended 11 September. Crude stocks stood 1% above their five-year seasonal average, gasoline stocks were 5% below it, and stocks of diesel and other distillate fuels were 13% below it. The US Energy Information Administration published the figures yesterday. Crude stocks fell by 0.6 million barrels over the week to 423.4 million barrels, roughly 0.1% of the prior stock level. That weekly move alone is not a major change in global supply.
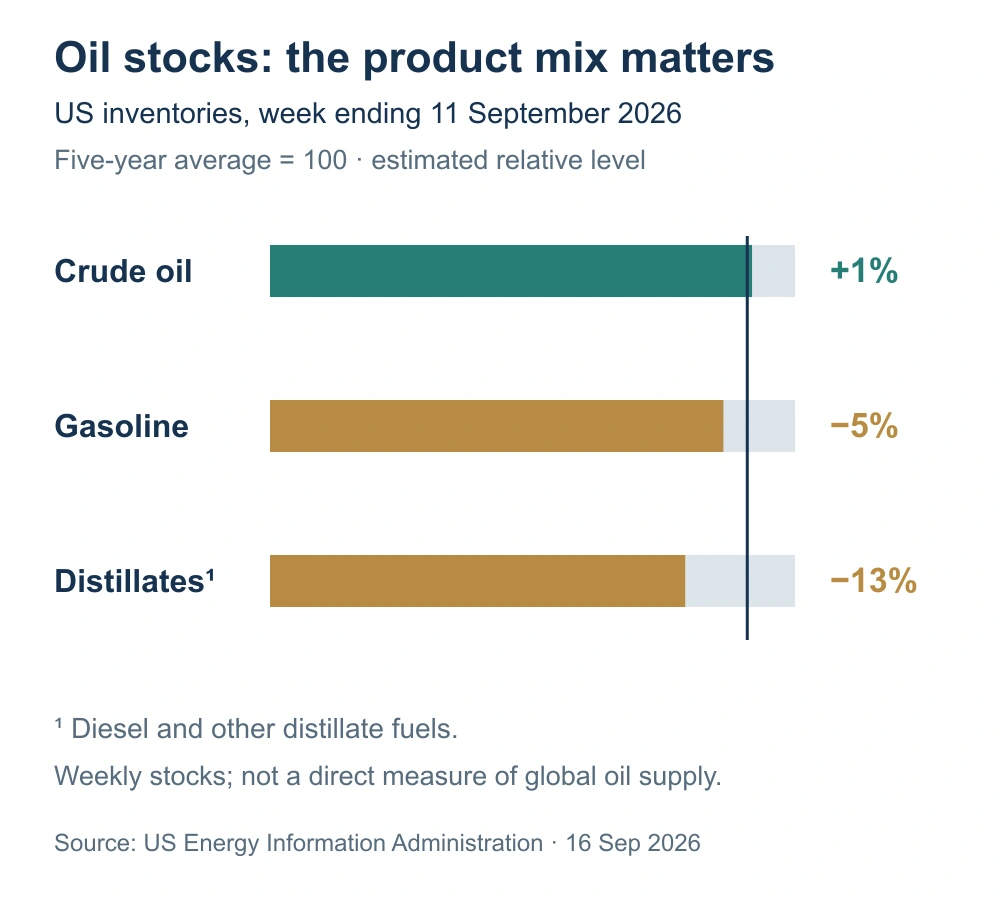
Refined fuel reaches freight companies and factories as an actual cost. Even with ample crude, a constraint in refining or distribution can raise the price of a particular product. The price that suits an oil producer need not suit an airline or haulier. The distillate shortfall is a risk signal, not proof that fuel prices must rise. In the next weekly report, watch product inventories, refinery runs and actual consumption. Dollar pricing adds a separate currency exposure for euro-based investors.
? Five-year stock average: what is being compared?
The US Energy Information Administration compares inventories with approximately the same seasonal week across five previous years. In the chart, 100 denotes that average; 87 means roughly 13% below it. This is a measure of US stocks, not worldwide production or a forecast of next week’s price.

Professional portfolio management
A plan for your portfolio. No rush.
Let’s discuss your goals, risk tolerance and time horizon. Find out how your portfolio would be built and managed.
The first conversation is free, with no obligation.
Today
What matters now
Europe’s production figures, also released yesterday, point in different directions
European industry needs both orders and affordable financing. Eurostat reported yesterday that seasonally adjusted euro-area industrial output fell 0.1% from June to July. Energy output rose 0.9%, capital goods rose 0.5%, and non-durable consumer goods fell 1.6%. The small negative overall figure therefore conceals opposing sector moves. These are July production volumes released on 16 September, not new September orders.
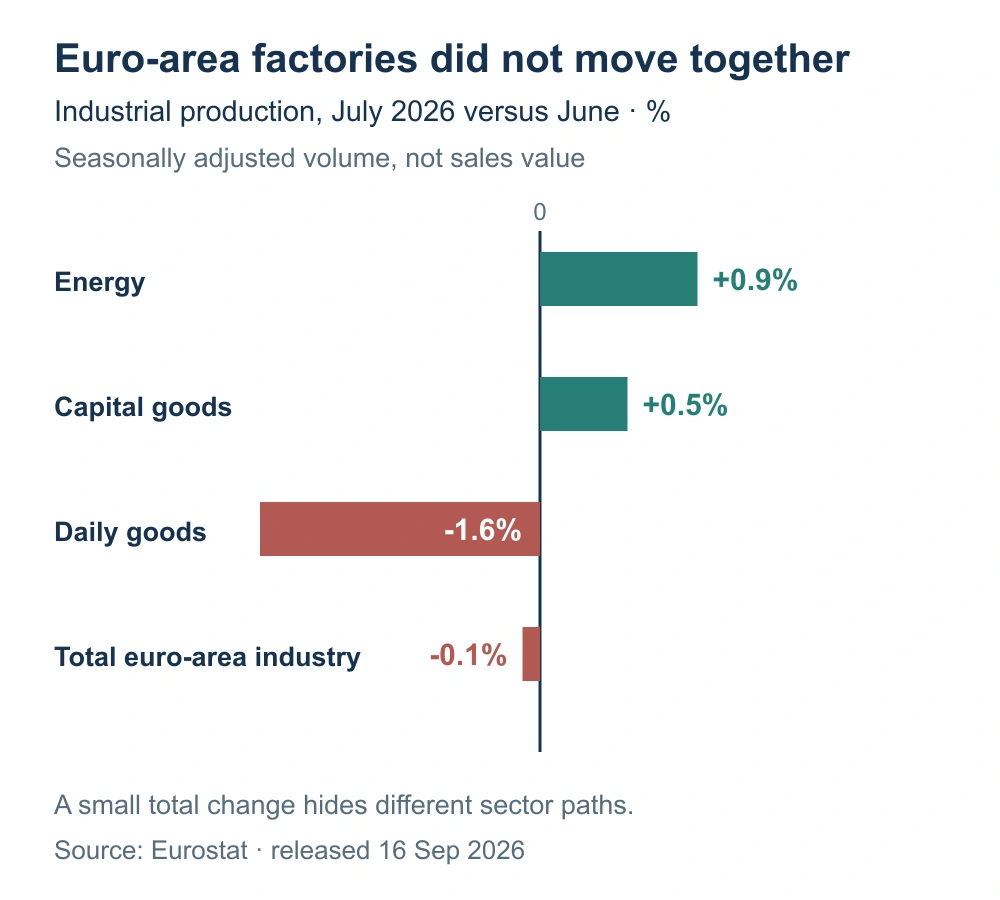
Higher output can support capital-goods manufacturers. For producers of everyday goods, weaker volumes combined with dearer energy are more difficult. The European Central Bank’s deposit facility rate rose to 2.50% under a decision taken on 10 September and effective yesterday; it was not a fresh decision this morning. More expensive new borrowing could later weigh on investment, although one July figure cannot establish that result. Upcoming orders, prices and corporate earnings will be the clearer test.
The portfolio question is who keeps the profit when revenue and costs both rise
Four releases from yesterday combine into one practical question. The Federal Reserve increased the cost of short-term borrowing, US consumers spent more dollars, imported products became dearer, and petroleum inventories differed sharply by product. None of this proves that all markets will move together. Stronger spending may help retailers and some services, while highly indebted or thin-margin businesses face pressure. Longer-term bond prices respond to rate expectations; producers and fuel-intensive transport firms often experience opposite sides of the same energy move.
The opportunity is sustained sales alongside stabilising costs. The risk is that sales look strong mainly because prices are higher while debt and fuel bills continue to rise. Rather than chasing the largest percentage, ask how much revenue remains after expenses. This morning’s assessment uses information released by the cutoff; later data require a separately dated judgement.
Today
What comes next
Which releases could change this assessment?
- Euro-area inflation data on 17 September. Eurostat plans to publish detailed August figures. They may show which price categories are driving pressure; they were not available at this morning’s cutoff.
- The next US weekly energy report. Watch whether the distillate-stock shortfall narrows and whether refinery output meets demand. One weekly figure is not a price forecast.
- The US employment report on 2 October and the Fed meeting on 27–28 October. Jobs, consumer prices and company margins may clarify how long rates need to stay high. These are future, not already known, outcomes.
Until new data are released, policymakers’ year-end forecasts should not be confused with futures-implied probabilities for the next meeting or a guaranteed decision.
Important. This is general market analysis, not a personal recommendation to buy or sell. Historical data and company results do not guarantee future returns. Forecasts and conditional scenarios may not materialise.
How is the history preserved and updated?
All five periods in this edition share one information date. Week means the latest 7 days, quarter means 90 days, and year means the trailing 12 months. The next dated edition will have a separate URL. This text keeps its date and assessment; later events are not silently inserted into an older edition. Longer periods assess new evidence alongside earlier developments without repeating every headline.