
Today · Market review
25 September: the economy is strong, but money is dearer
The central tension on the morning of 25 September is a strong US economy alongside rising long-term borrowing costs. Yesterday, 24 September, the ten-year yield reached 5.18%. Data from 23 September add to the picture: US businesses are expanding, but fuel stocks trail normal levels and slower growth is forecast for Europe. These earlier releases, not supposed new decisions this morning, frame the question: how much of higher revenue remains after higher costs?
Period covered: 2026-09-25Information as of 7 min read
Since the previous edition, the US ten-year yield rose from 4.96% on 22 September to 5.18% on 24 September. The business survey released on 23 September showed faster US expansion, while benefit claims on 24 September did not show a sudden surge in redundancies. New energy and OECD evidence shows that resilient demand, thin fuel stocks and slower European growth can coexist.
The distinction between a company’s sales, its profit and the price an investor pays still matters. Higher revenue does not always cover energy, labour and debt costs. A higher bond yield does not guarantee a short-term return, and an interest-rate decision cannot by itself restore energy supply.
Today
What happened
The US economy is holding up, but long-term borrowing is getting dearer
A strong economy is good news for business revenue, but not always for share and bond prices. On 24 September the US ten-year Treasury yield rose to 5.18%. It increased by 0.07 percentage points during the session and by 0.22 points from its 4.96% reading on 22 September. The two-year yield reached 4.87%. These are yesterday’s US readings, providing the backdrop to the morning of 25 September.
? Bond yields: what does 5.18% mean?
A yield relates a bond’s market price to its future payments. This is a standardised ten-year measure calculated by the US Treasury, not the return on an entire portfolio. A 0.22 percentage-point change is also called 22 basis points. When yields rise, existing fixed-rate bond prices normally fall; longer maturities usually move more.
There is little evidence yet of a sudden economic slowdown. Data published on 24 September showed 197,000 initial US unemployment benefit claims in the week ending 19 September, a thousand fewer than the revised previous week. That does not point to a sudden surge in redundancies, but it is not a count of new jobs. A day earlier, the preliminary September Purchasing Managers’ Index, or PMI, rose from 56.0 to 58.4. Companies reported both expanding activity and faster increases in their costs.
? Purchasing Managers’ Index: how should 58.4 be read?
The index summarises company responses about changes in activity compared with the previous month. Readings above 50 generally indicate expansion and those below 50 contraction. 58.4 is neither a percentage rate of economic growth nor inflation, and September’s reading is preliminary.
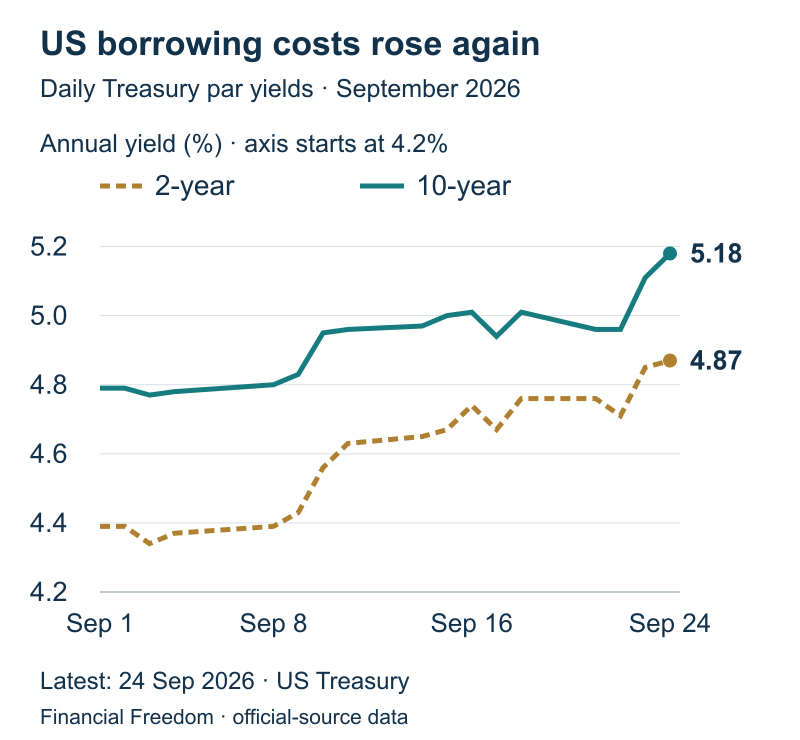
This combination explains the investor’s dilemma. Resilient demand can support sales, but dearer energy and rising business costs prevent complacency about inflation. Markets may then require greater compensation for lending over longer periods. That is an economic interpretation, not proof that one labour or survey release caused the entire yield move. The Federal Reserve raised its policy range to 3.75–4.00% on 16 September; there was no new rate decision yesterday.
For holders of longer-maturity fixed-rate bonds, a higher yield means pressure on prices. For a new buyer, it offers a higher starting yield without removing the risk of further price declines. In equities, attention belongs on companies that will soon need to refinance debt and highly valued technology businesses whose valuations rely on distant earnings. A profitable business with less debt faces a different risk from one financing its expansion through new loans.
The opportunity for bonds would improve if inflation slowed while demand held up. The opposite is the risk: resilient spending and rising costs could keep interest rates high for longer. The next important test is the US August spending and price data due on 30 September. One encouraging survey is not enough either to promise higher profits or to declare that rates have peaked.
For your investments
Let’s discuss your portfolio
 FINANCIAL FREEDOM01 / 04
Investment results since 1999
Are you beating
global equities?

at the end of the period
Jan 1999–Jun 2026 · EUR · Cumulative return, %
Linear scale · * MSCI World → MSCI ACWI.
Past performance does not guarantee future returns.
FINANCIAL FREEDOM02 / 04Historical comparison
How far did it fall?
How long to recover?
Decline from the previous high

Longest recovery to the previous high

Jan 1999–Jun 2026 · EUR · Monthly data
* MSCI World → MSCI ACWI.
Past performance does not guarantee future returns.
FINANCIAL FREEDOM03 / 04Personal investment consultation
Already investing?
Let’s review your portfolio.
Yet to start
investing?
Let’s build your first
investment plan.
FINANCIAL FREEDOM04 / 04
Personal investment
consultation
Martynas
Juška
Investment manager
Managing a portfolio
of more than€100 million
Crude stocks are rising, but fuel stocks offer less comfort
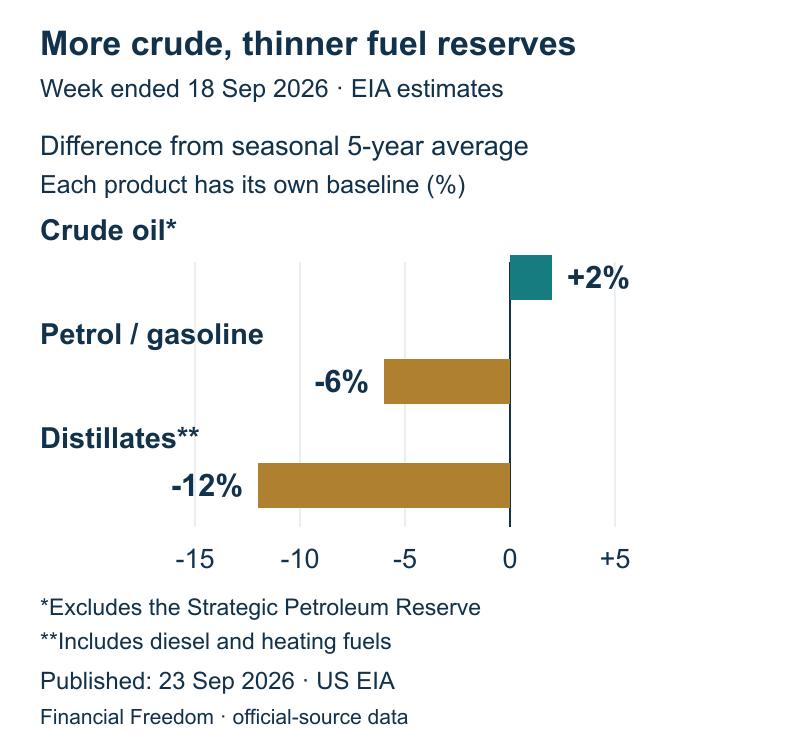
More crude oil in storage does not mean fuel-supply pressure is over. On 23 September the US Energy Information Administration reported that commercial crude stocks, excluding the strategic reserve, rose by 3.0 million barrels to 426.4 million in the week ending 18 September. They were around 2% above the five-year seasonal average. Petrol stocks, however, were 6% below their own average and distillate stocks 12% below theirs.
? Distillates and seasonal averages: what is being compared?
Distillates include diesel and heating-oil products. Each product’s stock is compared with its own average for the same time of year over five years. A 12% shortfall is neither a 12% rise in diesel prices nor the same share of total fuel demand.
Refining helps explain the gap. US plants processed 519,000 fewer barrels of crude per day than a week earlier, taking throughput to 16.8 million barrels a day. Less crude being processed can leave more in storage while replenishment of finished fuels slows. This does not mean every missing barrel must translate into a higher price, but it shows where there is less protection against another disruption.
For hauliers, airlines and energy-intensive manufacturers, the final fuel bill matters. For refiners, the difference between product selling prices and crude purchase prices matters, so rising crude inventories alone do not explain their profits. Higher refining throughput and replenished product stocks would create an opportunity for fuel-sensitive sectors. Another supply interruption before stocks recover is the risk. Subsequent EIA weekly reports will show whether the gap is narrowing.
Europe has less growth to absorb higher costs, while technology must earn a return on expansion
The world economy has not stalled, but regions face different cost pressures. On 23 September the Organisation for Economic Co-operation and Development forecast global growth of 2.9% in 2026. Its projections were 2.2% for the US and 1.0% for the euro area. These are forecasts from the same organisation, not final full-year results. Slower European demand leaves companies less room to pass higher energy and interest costs on to customers.
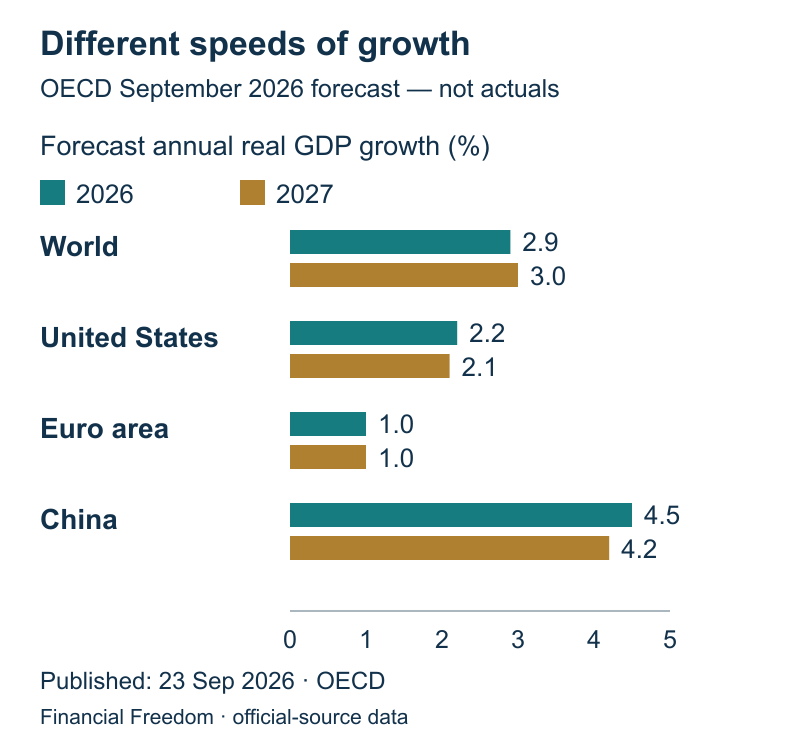
Revenue growth alone is therefore insufficient in European industry and retail. What matters is whether sales volumes also increase and profit margins hold up. Property businesses refinancing debt face an additional interest bill. An earlier European Central Bank decision raised its deposit rate to 2.50% from 16 September. That remains part of the backdrop, not a new decision today.
Investment in artificial-intelligence infrastructure provides a counterweight. The organisation identifies it as a support for growth and trade, but also warns about greater reliance on external funding. An equipment order can immediately lift the supplier’s revenue, while the data-centre owner still needs customers, electricity and enough cash flow to service loans. A supplier making a sale and its customer earning a return on that investment are not the same event.
The opportunity remains with companies able to support expansion with real orders and cash generated by their operations. Risk is greater where expensive construction and debt pay off only under an optimistic demand scenario. Memory-chip maker Micron’s results presentation on 30 September will help test data-centre demand and supply. It is an upcoming signal for the supply chain, not a promise that its shares or the technology sector will rise.

Check your saving plan
Are your monthly contributions enough?
Compare your monthly contribution with your target future income. Adjust the time horizon to see how the amount you need changes.
This compares scenarios; it does not promise a future outcome.
Today
What matters now
Two opposing forces are shaping portfolios
Resilient US demand supports business sales, but higher bond yields increase the cost of new finance. Energy adds another constraint: rising crude inventories do not guarantee the same improvement in finished fuels. It therefore makes little sense to label every bond unattractive or every technology company equally resilient. Debt maturity, cash reserves and the speed at which investment starts earning money differ.
In bonds, the higher starting yield must be weighed against potential price swings and the issuer’s ability to pay. In equities, revenue growth needs to be checked against margins and cash flow. Slower European growth makes it harder to pass costs on, while stronger US demand may keep rates elevated for longer. For a euro investor, exchange rates also affect unhedged dollar holdings; an unverified currency move is not presented as fact here.
A more favourable combination would be slower price increases, rebuilding fuel stocks and resilient corporate profit. The adverse combination would be expensive funding alongside weakening demand. The latest evidence does not make either outcome inevitable.
Today
What comes next
Three signals that could change the conclusion
- US prices and spending on 30 September. The August Personal Consumption Expenditures Price Index will test whether price pressure is easing; real spending will separate a greater volume of purchases from a larger bill.
- Micron’s results on 30 September. Memory-chip orders, pricing and planned investment matter alongside headline revenue growth. The results had not been released by this edition’s cutoff.
- The next US fuel-stock reports. Watch whether refining throughput, petrol stocks and distillate stocks recover together. An increase in crude alone will not answer the whole question.
? Personal Consumption Expenditures Price Index: what does it measure?
This index measures changes in the prices of goods and services consumed, including spending made by others on consumers’ behalf. Its weights adjust with the composition of spending, so it is not identical to the Consumer Price Index. Price growth and growth in real consumption answer different questions.
Important. This is general market analysis, not a personal recommendation to buy or sell. Historical data and company results do not guarantee future returns. Forecasts and conditional scenarios may not materialise.
How is the history preserved and updated?
All five periods in this edition share one information date. Week means the latest 7 days, quarter means 90 days, and year means the trailing 12 months. The next dated edition will have a separate URL. This text keeps its date and assessment; later events are not silently inserted into an older edition. Longer periods assess new evidence alongside earlier developments without repeating every headline.