
Quarter · Market review
90 days: energy disruption reached rates and debt costs
Across 90 days, disruptions and a partial recovery in energy supply changed price expectations. In September the Fed and the European Central Bank raised policy rates, and final August data confirmed higher European inflation. Stronger US sales and fewer benefit claims are offsets, not proof that every company is making more profit.
Period covered: 2026-06-24 – 2026-09-21Information as of 7 min read
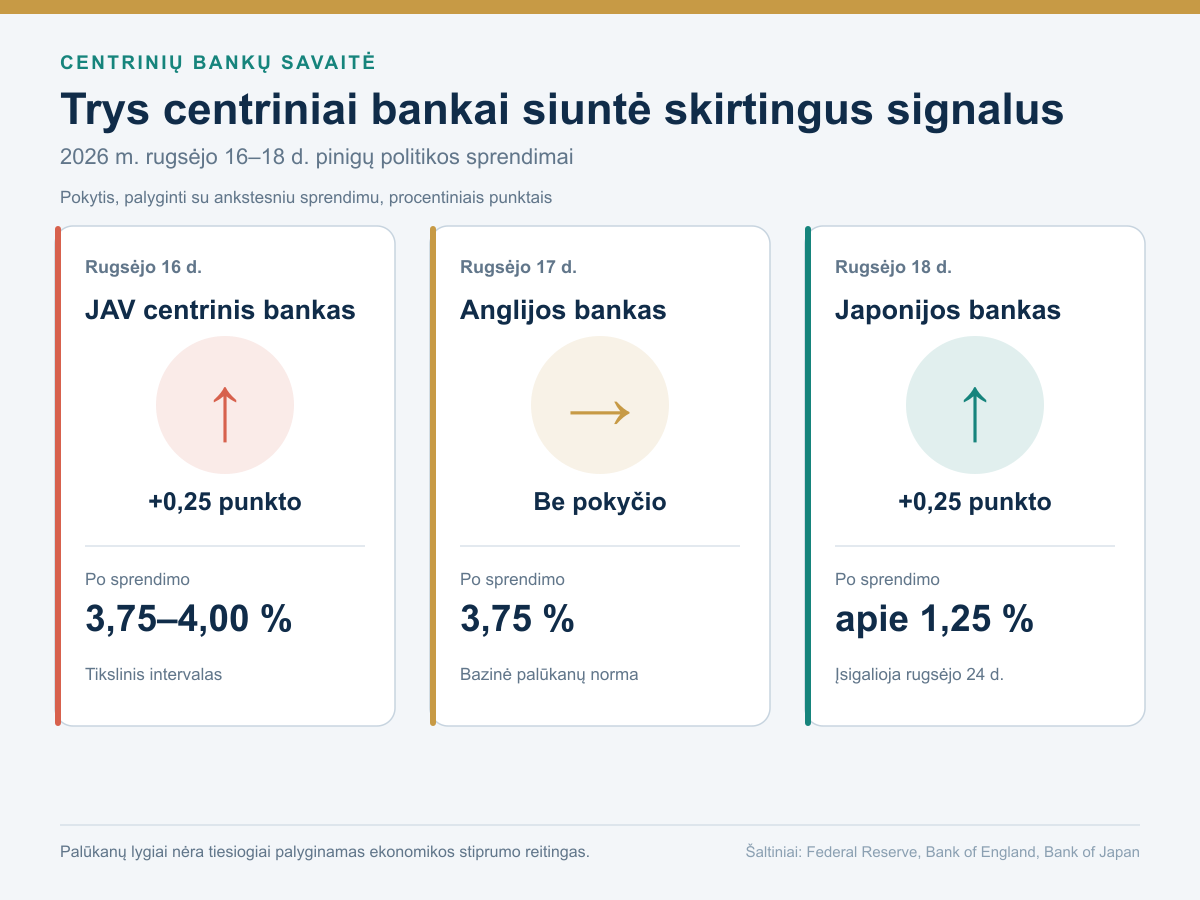
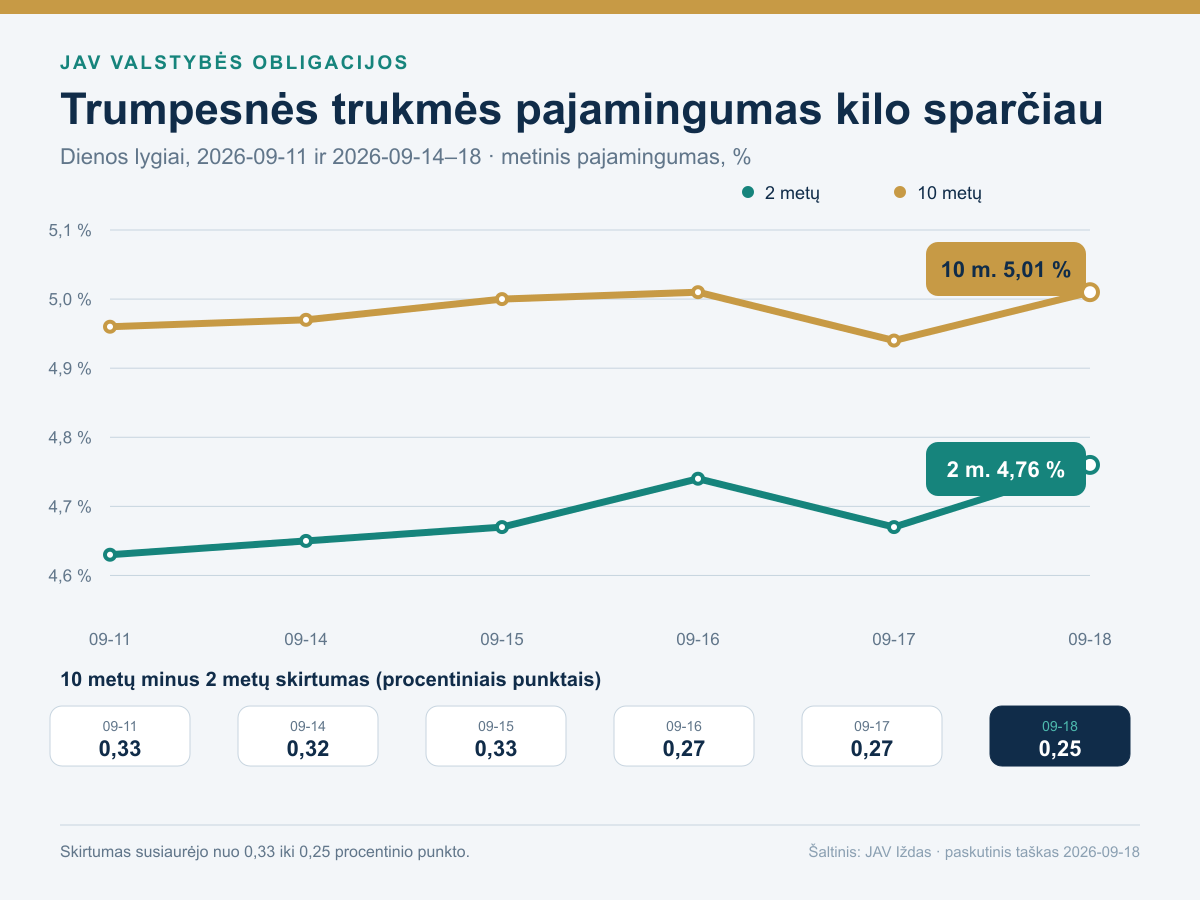
Since the previous information cutoff, the most important confirmed change came on 18 September: the Bank of Japan voted 7–2 to raise its overnight-rate guideline to about 1.25%, effective 24 September. Friday US Treasury estimates ended the week at 4.76% for two years and 5.01% for ten, narrowing the spread to 0.25 percentage points. By 07:00 on 21 September, China had supplied CNY165 billion of seven-day liquidity at 1.40%, while Sunday's lending benchmarks remained 3.00% and 3.50%.
The longer-horizon conclusion is unchanged: the key question is not one central-bank headline but whether revenue growth leaves more profit after energy, imported inputs and debt costs. China's short liquidity operation is not proof of a consumer recovery. One yield-curve observation does not guarantee the direction of the economy, and inflation of 3.2% in the euro area and 5.6% in Lithuania does not mean every item rose equally.
Quarter
What happened
The starting point: interest rates had already risen on 17 June
This 90-day period begins on 24 June. Before it began, on 17 June, the European Central Bank’s previously announced interest rate increase took effect. The rate on banks’ overnight deposits rose from 2.00% to 2.25%. These are the initial conditions before the period under review, not a new event within it.
Also on 17 June, the Federal Reserve left the federal funds target range at 3.50–3.75%. It made no change on 29 July. Europe also chose a pause on 23 July. For a business with debt, this meant that energy costs would not be offset by automatically and rapidly falling interest rates.
The starting backdrop: the 18 June agreement had not yet restored shipping
The US–Iran memorandum was presented as a route towards ending hostilities and reopening the Strait of Hormuz. The economic benefit depended on what happened after the signatures: could ships sail safely, would insurance be available, and would oil actually reach buyers?
More reliable deliveries would have reduced importing industries’ need to hold expensive inventories. Hauliers would have found fuel and route planning easier. But the agreement itself was not a statistical record of restored flows. July and August data later required a more cautious assessment of precisely this assumption.
July: the supply recovery was not sustained
The International Energy Agency’s 10 July review described a partial recovery in June flows and ceasefire violations on 7–8 July. Its 12 August report said Persian Gulf oil exports in July, including routes bypassing the strait, averaged 15 million barrels per day. That was 2.1 million, or about 12%, below June.
This comparison describes two monthly averages, not a one-day shipping halt. It showed that June’s hopes had not been enough to deliver a lasting improvement. US military statements on 5 and 8 September about strikes on Iranian tankers were a reminder that delivery security remained unresolved. A particular price move cannot be attributed solely to these statements.
23 July: trade rules and sanctions added to the planning burden
The European Union’s 21st sanctions package against Russia expanded restrictions on energy, financial services and the shadow fleet. For companies, this matters beyond politics: payment, insurance and cargo transport options change. But an announced restriction is not a measured fall in exports of the same size.
On the same day, the Office of the US Trade Representative announced measures concerning 60 economies under Section 301 of the Trade Act. Tariff treatment depended on the product, origin and exemptions. A broad tariff headline was therefore not enough for an importer: the specific supply chain had to be assessed. This legal and logistical burden added conditions that an oil price chart alone cannot show.
Late July and August: the technology transaction had two sides
Demand for technology was visible both in sellers’ revenue and in customers’ investment bills. On 29 July, Microsoft reported capital expenditure, including finance leases, of 41 billion US dollars for the quarter ended 30 June. Cash purchases of property and equipment were 35.8 billion dollars. These amounts must not be added together: the first includes finance leases, while the second shows asset purchases paid for in cash during the quarter.
The company generated 55.4 billion dollars in operating cash flow. Subtracting cash purchases of property and equipment left 19.6 billion dollars. This explains why a rapid pace of construction is not automatically a bad signal: what matters is how much cash the business generates and how much more it needs from outside.
On 26 August, chip designer NVIDIA reported revenue of 96.221 billion dollars for the quarter ended 26 July, up 106% year on year. Operating profit grew 124%. Some customer spending had therefore already become real earnings for the supplier. For customers to earn a return on their investments, however, their new services need demand and must cover equipment, electricity and financing costs.
August and September: growth continued, but costs did not disappear
Economic data showed resilience, not a general halt in growth. The second estimate of US second-quarter gross domestic product showed annualised growth of 1.5%, or about 0.4% quarter on quarter. Euro-area growth was revised to 0.6% quarter on quarter on 7 September. These figures need to be put on the same time basis before comparing the regions.
The US added 162,000 jobs in August; the data were released on 4 September. On 9 September, second-quarter revenue growth in selected US service industries was revised to 3.0% from the previous quarter. This revenue measure has not been adjusted for prices. Rising sales and a greater real volume of services delivered are therefore not the same thing.
9–11 September: the energy question reached monetary policy
On 9 September, the US Energy Information Administration raised its second-half average Brent price forecast to about 90 dollars per barrel. Model inputs were finalised on 3 September. This is a conditional average for a future period, not the oil price on 15 September and not an already measured effect of later military action.
On 10 September, the European Central Bank announced another interest rate increase of 0.25 percentage points. The deposit facility rate rose from 2.25% to 2.50% on 16 September. On 11 September, the US Consumer Price Index showed annual inflation of 3.4% in August, the same as in July. The seasonally adjusted monthly change accelerated from 0.1% to 0.4%. These data are already known and form a new backdrop to the Federal Reserve meeting of 15–16 September.
? How should we read GDP and price indices?
Gross domestic product measures the value of final goods and services produced in an economy. Real growth removes the effect of prices. US quarterly growth is often reported at an annualised rate, as if the same change continued for four quarters. The Consumer Price Index measures a basket of prices weighted by consumption. Its annual and monthly changes have different comparison bases. The Personal Consumption Expenditures Price Index also includes spending made on consumers’ behalf, uses different weights and accounts for changes in the composition of consumption; these two price indices should not be treated as interchangeable.
Mid-September: June’s hopes were not enough to restore supply
The International Energy Agency’s 11 September forecast projected a larger fall in oil supply than in demand this year. This is a forecast, not the final annual result.
Lower demand does not automatically mean cheaper oil. If the volume reaching buyers falls faster, fuel bills can remain high even as the economy slows. This can help an energy producer only if it can deliver its output. For a haulier or an energy-buying factory, the same situation raises costs.

Investment consultation
Do your investments work together?
Review where your money is invested, how much depends on a single market and whether your plan fits your goals. Leave with clearer next steps.
See the consultation process and terms on the registration page.
Quarter
What matters now
The priority now is to compare different financing channels
The US, Japan and the euro area raised rates during September, the Bank of England held, and China supplied short liquidity without changing its lending benchmarks. There is no single global interest-rate number. A highly indebted company needs to know when debt is refinanced and in which currency. A bank watches both lending margin and customer credit quality. A long-duration bond is sensitive to market yields, while an exporter also depends on demand and the exchange rate.
The US two-year yield rose more than the ten-year yield over the week, narrowing the spread to 0.25 points. That focuses attention on near-term refinancing costs, but one curve move is not an economic verdict. On prices, energy and services remained the largest contributors to euro-area inflation. Equity investors therefore need to test pricing power, bond investors need maturity and credit quality, and Lithuanian households face a local 5.6% rate above the 3.2% euro-area average.
? Yield: what does it measure?
Yield is the market-implied return to a bond’s maturity based on its current price and cash payments. It is not the same as a central-bank rate or a guaranteed investor return if the bond is sold before maturity.
Quarter
What comes next
What to watch next
The next checks are implementation of Japan’s new rate from 24 September, the broader US employment report on 2 October and the next euro-area inflation estimate. In China, the test is whether short liquidity and unchanged lending benchmarks appear in consumption and real orders. Easing price pressure alongside resilient profit would weaken today’s financing-risk thesis. Further increases in import, energy and borrowing costs without matching revenue would reinforce it.
Important. This is general market analysis, not a personal recommendation to buy or sell. Historical data and company results do not guarantee future returns. Forecasts and conditional scenarios may not materialise.
How is the history preserved and updated?
All five periods in this edition share one information date. Week means the latest 7 days, quarter means 90 days, and year means the trailing 12 months. The next dated edition will have a separate URL. This text keeps its date and assessment; later events are not silently inserted into an older edition. Longer periods assess new evidence alongside earlier developments without repeating every headline.