
Year · Market review
One year: rate cuts gave way to tightening and a profit test
Over twelve months, US rate cuts gave way to the 16 September increase; Europe also resumed raising rates after a pause. Trade and energy events changed assumptions about costs and growth. Technology demand and consumer spending supported revenue, while final August inflation showed why profit and debt risks still differ across sectors.
Period covered: 2025-09-23 – 2026-09-22Information as of 11 min read
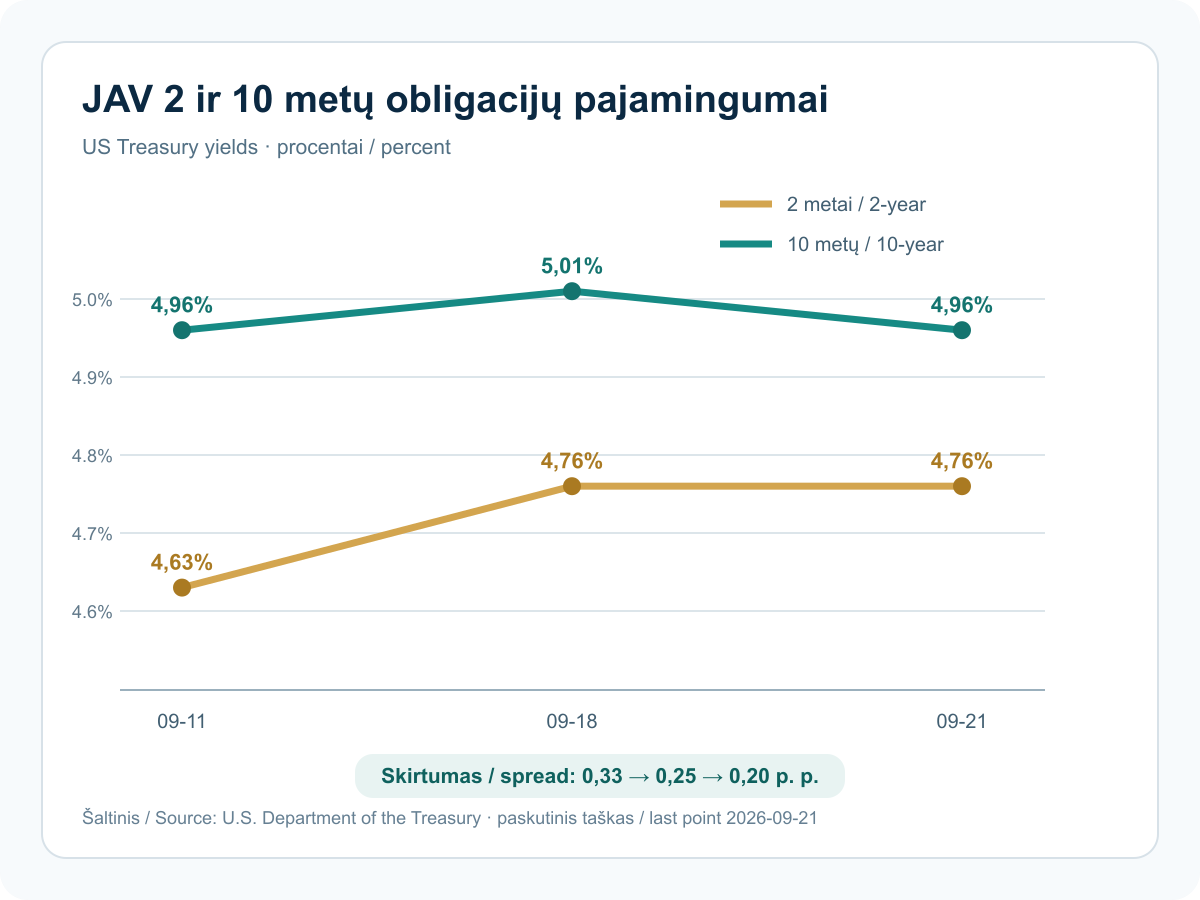
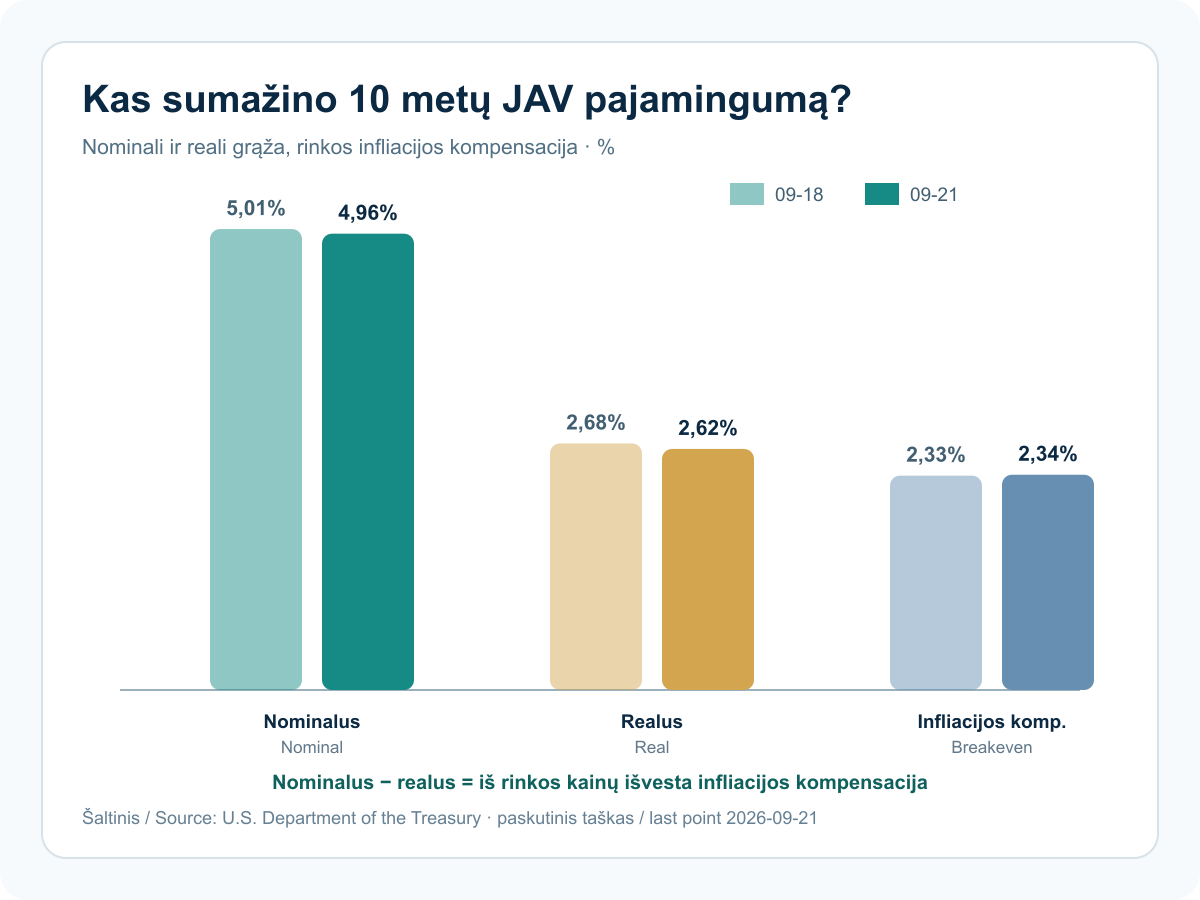
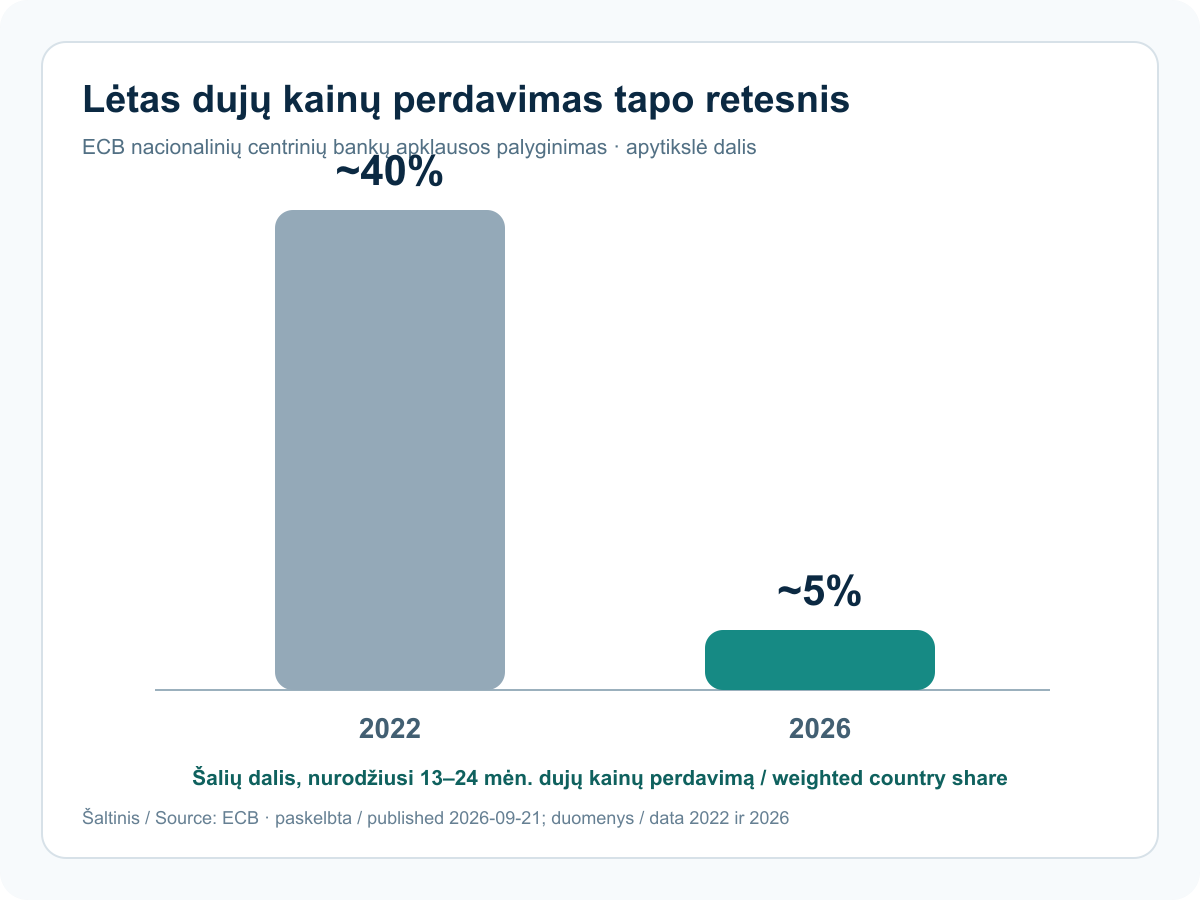
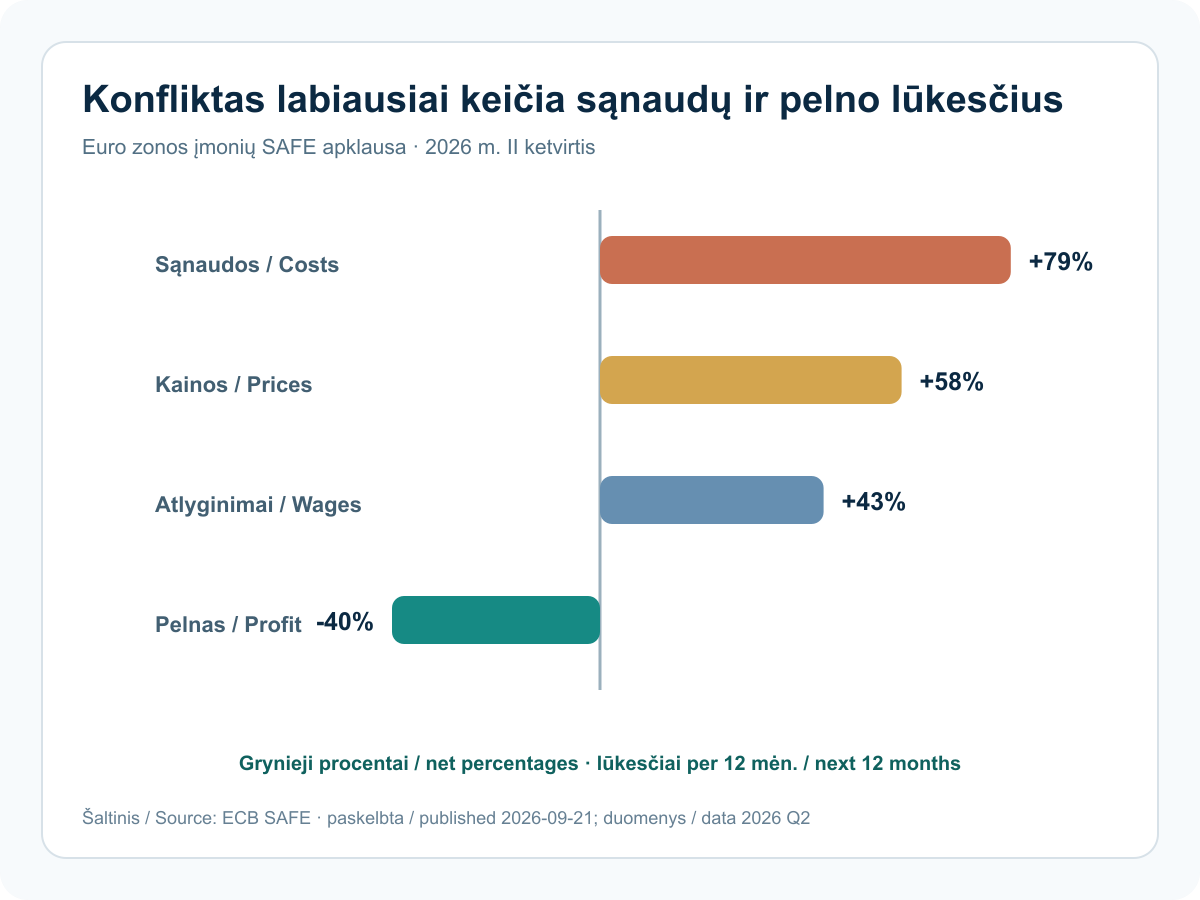
Three things changed since the previous cutoff. On 21 September, the US ten-year nominal yield fell to 4.96%, the real yield to 2.62%, and the S&P 500 rose 1.49%. The ECB published evidence that gas-price moves reach consumers faster and that company cost expectations greatly exceed profit expectations. Before 07:00 on 22 September, the Bank of Korea supplied KRW34.00 trillion in 14-day liquidity without cutting its policy rate.
The longer-horizon conclusion is unchanged: a lower yield alone does not guarantee higher equity profit or a safe bond return. Investors still need to separate the real discount rate, inflation compensation, credit quality and a company’s ability to pass on energy and labour costs. Temporary central-bank liquidity is not the same as a recovery in final demand.
Year
What happened
Autumn 2025: US interest rates fell while Europe opted for a pause
Before this rolling period began, on 17 September 2025, the Federal Reserve cut its target range from 4.25–4.50% to 4.00–4.25%. That is the starting background, not an event after 23 September. It cut the range by another quarter point on both 29 October and 10 December, reaching 3.50–3.75%. Each decision took effect the following day.
Lower interest rates helped some borrowers, but their benefits cannot be separated from the reason for the cuts. If a central bank cuts rates because it sees weaker demand, a company’s cheaper loan may be offset by poorer sales. That is why the simple rule that “rates were cut, so that is good for shares” does not explain the market’s entire reaction.
During the autumn, the European Central Bank kept the rate paid on banks’ overnight deposits at 2.00%. Its 11 September decision was announced before this rolling twelve-month period began, but established its starting backdrop. The rate remained unchanged at the October and December meetings. The US and the euro area were therefore already following different paths.
November: trade gained some breathing room, but not an end to every barrier
On 1 November, the US announced the terms of an agreement with China providing for reductions in some tariffs and a suspension of rare-earth export restrictions from 10 November. This was an important signal of relief for supply chains. Rare earths are used in a range of industrial and technological equipment, so the availability of these materials matters to more than just their producers.
However, temporary relief is not a permanent, unchanging rule. A factory needs to know when a component will arrive and what its final cost will be. Uncertainty encourages companies to hold larger inventories or seek a more expensive alternative supplier. The November decision therefore cannot automatically be presented as the tariff applying to all goods today: subsequent measures have their own legal bases and conditions.
January 2026: switching energy suppliers became a concrete plan
On 26 January, the Council of the European Union approved a gradual phase-out of Russian gas imports. A full ban on liquefied natural gas is scheduled from the beginning of 2027, and on pipeline gas from autumn 2027. These are future deadlines with transition periods, not a halt to all imports on that January date.
This decision turned diversification into a matter of contracts and infrastructure. Other suppliers, ships, terminals and reserves were needed. Over time, a wider choice of suppliers may reduce dependence, but the transition itself also costs money. Investors need to distinguish the long-term benefits of resilience from the near-term bills for energy and infrastructure.
Meanwhile, the US central bank was in no hurry to continue the autumn cuts. The 3.50–3.75% range remained unchanged at its January, March and April meetings. Europe’s February, March and April decisions also maintained the 2.00% deposit facility rate. Earlier cuts were not a promise that every subsequent meeting would follow the same pattern.
February: the legal basis for tariffs changed
On 20 February, the US Supreme Court ruled that the International Emergency Economic Powers Act does not authorise the president to impose tariffs. The decision restricted a specific legal basis. It did not mean that all US import tariffs disappeared, because other measures relied on different laws.
On the same day, the administration announced a temporary 10% import surcharge, with exemptions, under a different section of the Trade Act. It took effect on 24 February, and its 150-day term ended on 24 July. This is a historical measure, not a tariff automatically applying to all imports today.
For businesses, changes like these mean having to recheck a product’s origin, classification code, delivery date and exemptions. An importer uncertain of the final cost may delay an order or hold more inventory. Even a politically favourable headline therefore does not always immediately reduce a company’s costs or increase its sales.
February's results showed that technology demand was more than a promise
On 25 February, chip designer NVIDIA reported results for its financial year ended 25 January. Revenue reached $215.938 billion, while net income under US accounting standards was $120.067 billion. Both figures were 65% higher than in the company’s previous financial year. These are results for a completed period, not a forecast for calendar year 2026.
This matters to the longer story: technology suppliers were generating visible, actual earnings well before the summer results season. But profit does not answer the question of an investment’s price. Even a successful company may be valued on very high expectations for the future that subsequently prove harder to meet.
Spring: geopolitical risk became an oil delivery problem
The war in the Middle East that began on 28 February disrupted oil shipments through the Strait of Hormuz. On 11 March, International Energy Agency member countries agreed to make 400 million barrels of emergency oil reserves available to the market. This was the largest coordinated release amount in the agency’s history. The decision was a commitment to release reserves, not the release of the entire volume in one day.
Reserves can buy time, but cannot replace commercial supply indefinitely. When reliable deliveries are lacking, the effects spread from the oil market to fuel, transport, chemicals and household purchasing power. More expensive energy can simultaneously raise inflation and weaken growth. A central bank faces an uncomfortable choice: raising interest rates does not produce additional oil, but cutting them may stimulate demand at a time when supply is constrained.
May: the story of global trade was not only one of closing borders
On 1 May, provisional application of the trade agreement between the European Union and the South American Mercosur countries began. Tariffs on some goods were reduced or removed. This marked a move from negotiations to applicable trade preferences, but was not yet the full, finally ratified partnership agreement.
European exporters gained opportunities to reach buyers on more favourable terms. For importers, a wider choice may help reduce dependence on a single supplier. At the same time, greater competition puts pressure on more vulnerable sectors. Actual orders and the use of trade preferences ultimately reveal the investment significance, not just the headline on the day an agreement is signed or takes effect.
June and July: Europe's interest rate direction reversed
On 11 June, the European Central Bank announced a 0.25 percentage point rate increase. The deposit facility rate rose to 2.25% from 17 June. It was left unchanged on 23 July. The US maintained its 3.50–3.75% target range at the 17 June and 29 July meetings. US cuts had therefore given way to a pause, while Europe had already turned towards higher rates.
The 18 June memorandum between the US and Iran raised hopes of normalising supply. But the International Energy Agency’s 10 July report already described ceasefire breaches on 7–8 July. Its August edition showed weaker oil export flows in July. An agreement and its implementation proved to be two separate stages that matter to investors.
On 23 July, the European Union expanded its energy and financial sanctions against Russia. The Office of the US Trade Representative announced a decision concerning 60 economies under Section 301 of the Trade Act on the same day. Tariffs depended on the product and applicable conditions; this was not an automatic extension of the temporary surcharge announced in February. Over the year, both supply routes and the rules governing what buyers pay for goods changed.
Summer: the supplier's profits grew while customers faced the expansion bill
On 26 August, NVIDIA reported revenue of $96.221 billion for the quarter ended 26 July. Revenue was 106% higher and operating profit 124% higher than a year earlier. This result confirmed that demand for the supplier remained real. Its customers, however, pay for equipment, data centres and electricity infrastructure before receiving all their expected revenue.
In late July, Microsoft reported that it generated $55.4 billion in operating cash flow during the quarter ended 30 June and spent $35.8 billion in cash on purchases of long-term assets. In Oracle’s quarterly results released in September, capital expenditure already exceeded operating cash flow. These are not identical businesses, but the comparison shows why the technology story requires monitoring more than revenue growth.
Early September: prices brought attention back to interest rates
On 9 September, the US Energy Information Administration raised its forecast for the average Brent price in the second half of the year to around $90 per barrel. The publication used model inputs finalised by 3 September. It therefore does not measure the impact of later military reports in September and is not the latest exchange price.
On 10 September, the European Central Bank announced another 0.25 percentage point rate increase. On 11 September, the US Consumer Price Index showed annual price growth of 3.4% in August, unchanged from July. Seasonally adjusted monthly growth increased from 0.1% to 0.4%. However, annual growth in the basket excluding food and energy slowed from 2.5% to 2.4%. Monthly growth in this basket nevertheless increased from 0.2% to 0.3%. The conclusion is therefore not that “all price indicators are worsening”, but a more complex combination of differing rates of change.
The interest rate path in one place
The table shows every change to key US and euro area interest rates announced during this twelve-month period, together with the latest July decisions to leave them unchanged. It is not a list of every meeting. Europe’s decision announced on 10 September took effect on 16 September.
| Decision date | Region | Before | After | When it applies |
|---|---|---|---|---|
| 2025-09-17 | US | 4.25–4.50% | 4.00–4.25% | From 18 September |
| 2025-10-29 | US | 4.00–4.25% | 3.75–4.00% | From 30 October |
| 2025-12-10 | US | 3.75–4.00% | 3.50–3.75% | From 11 December |
| 2026-06-11 | Euro area | 2.00% | 2.25% | From 17 June |
| 2026-07-23 | Euro area | 2.25% | 2.25% | Left unchanged |
| 2026-07-29 | US | 3.50–3.75% | 3.50–3.75% | Range left unchanged |
| 2026-09-10 | Euro area | 2.25% | 2.50% | In effect from 16 September |
| 2026-09-16 | US | 3.50–3.75% | 3.75–4.00% | From 17 September |
For the US, the table shows the federal funds target range; for the euro area, it shows the specific deposit facility rate. On 16 September, Europe’s rate is already 2.50%. Compared with the start of this period after the US decision of 17 September 2025, the US range is now 0.25 percentage points lower. The European deposit rate rose 0.50 percentage points. The US increase of 16 September is included in the table.
? Consumer Price Index: why does the monthly change matter too?
The Consumer Price Index is compiled using the prices of goods and services and their weights in consumption. The annual change compares prices with the same month of the previous year. The seasonally adjusted monthly change helps show the latest pace. The annual figure can therefore remain unchanged even when prices rise faster in the latest month.
Mid-September: the timing of recovery became a key assumption again
The International Energy Agency’s 11 September forecast projects a larger decline in oil supply than in demand this year. This is a forecast, not a final annual result.

Professional portfolio management
A plan for your portfolio. No rush.
Let’s discuss your goals, risk tolerance and time horizon. Find out how your portfolio would be built and managed.
The first conversation is free, with no obligation.
Year
What matters now
The priority now is to separate a friendlier discount rate from profit pressure
On 21 September, the long US yield fell while the two-year rate was unchanged. The ten-year real yield declined slightly more than the nominal yield, leaving implied inflation compensation almost unchanged. The combination is more supportive in the short term for long-duration bonds and equities whose value depends on distant earnings. It does not show that economic or price risk has ended.
The ECB evidence explains the counterweight. A gas-price shock can now reach consumers faster, while companies more often expect higher costs and wages than higher profit. An asset’s rate-sensitive valuation can therefore improve at the same time as some company margins deteriorate. Pricing power, debt maturity and energy intensity matter more than the sector label alone.
South Korea’s KRW34.00 trillion operation illustrates a third channel: financial-system liquidity. It can stabilise short-term funding but does not answer whether final demand is growing. Bond portfolios need to compare duration with credit quality, equity portfolios margin with net debt, and multi-currency portfolios local returns with exchange-rate moves. The opportunity is a lower real return alongside resilient profit; the risk is faster energy pass-through alongside weaker demand.
? Why do the four charts show several channels rather than one forecast?
The curve shows the price of different maturities, the nominal-real gap separates real return from inflation compensation, the energy chart shows pass-through timing, and the company survey shows the direction of expectations. None of them alone forecasts the whole portfolio.
Year
What comes next
What to watch
Japan’s new rate guideline takes effect on 24 September. South Korea’s 14-day liquidity operation matures on 6 October. US labour data and a new euro-area inflation estimate due on 2 October will test whether lower real yields can coexist with resilient demand. Actual company margins, rather than survey expectations alone, will change the longer-term conclusion: if profit withstands cost pressure, the friendlier discount rate will have firmer support; if not, the valuation relief may be brief.
Important. This is general market analysis, not a personal recommendation to buy or sell. Historical data and company results do not guarantee future returns. Forecasts and conditional scenarios may not materialise.
How is the history preserved and updated?
All five periods in this edition share one information date. Week means the latest 7 days, quarter means 90 days, and year means the trailing 12 months. The next dated edition will have a separate URL. This text keeps its date and assessment; later events are not silently inserted into an older edition. Longer periods assess new evidence alongside earlier developments without repeating every headline.