
30 days · Market review
30 days: real-yield relief followed tighter policy
Over 30 days, energy and financing costs became more important again. Final euro-area inflation for August reached 3.2% and Lithuania 5.6%. US and European central banks raised policy rates this month even as US bond yields fell yesterday. Revenue is a genuine offset, but investors still need to see how much becomes profit.
Period covered: 2026-08-24 – 2026-09-22Information as of 7 min read
Three things changed since the previous cutoff. On 21 September, the US ten-year nominal yield fell to 4.96%, the real yield to 2.62%, and the S&P 500 rose 1.49%. The ECB published evidence that gas-price moves reach consumers faster and that company cost expectations greatly exceed profit expectations. Before 07:00 on 22 September, the Bank of Korea supplied KRW34.00 trillion in 14-day liquidity without cutting its policy rate.
The longer-horizon conclusion is unchanged: a lower yield alone does not guarantee higher equity profit or a safe bond return. Investors still need to separate the real discount rate, inflation compensation, credit quality and a company’s ability to pass on energy and labour costs. Temporary central-bank liquidity is not the same as a recovery in final demand.
30 days
What happened
Late August: the economy grew, but consumers chose more cautiously
At the start of this month-long period, there was no basis for calling the whole economy weak. The second estimate of US second-quarter gross domestic product, released on 26 August, showed annualised growth of 1.5%. That is about 0.4% above the previous quarter, not 1.5% growth in three months. Private domestic demand grew faster than the headline measure, so a single figure did not describe conditions for every business.
Consumption data also showed that more dollars spent do not necessarily mean more goods bought. July’s Personal Consumption Expenditures Price Index, released on 26 August, showed annual price growth of 3.7%. Real consumption expenditure, which removes the effect of prices, increased by less than 0.1% over the month. This distinction is worth remembering when reading companies’ reports of rising revenue.
Technology suppliers showed earned profits, not promises
Technology results provided the strongest counterweight to cost concerns. On 26 August, chip designer NVIDIA reported quarterly revenue of 96.221 billion US dollars, up 106% year on year. Operating profit under US accounting standards grew even faster, by 124%. These are results for the quarter ended 26 July, although the company calls it the second quarter of fiscal 2027.
Semiconductor and infrastructure software company Broadcom also confirmed revenue growth on 2 September. Its quarterly revenue reached 29.6 billion dollars, up 86% year on year. Two companies do not represent the whole sector, but their results show that some demand for artificial intelligence infrastructure has already turned into sales. How much the customers buying that equipment will earn remains a separate question.
Early September: growth and more expensive energy appeared in the same picture
European statistics did not allow a simple choice between good growth and bad inflation. The preliminary euro-area estimate for August, released on 1 September, showed annual consumer price inflation of 3.3%, compared with 2.9% in July. Energy prices rose 14.3% year on year, while services inflation slowed. Prices were moving unevenly, rather than the entire consumer basket getting more expensive at one uniform pace.
On 7 September, euro-area second-quarter growth was revised to 0.6% quarter on quarter. That was a better estimate of an earlier period, not extra growth that suddenly appeared in September. The US increase of 162,000 jobs in August, announced on 4 September, also showed resilience. June and July gains had been much smaller. Businesses still had customers, but that did not make it easier to promise rapid interest rate cuts.
The oil problem was delivery as well as price
Unreliable supply complicated the energy story. On 5 and 8 September, US Central Command reported strikes on Iranian tankers. These are statements from a party to the conflict, not an independent measurement of all oil flows. Even so, they were a reminder that June’s diplomatic agreement did not yet mean shipping had been reliably restored.
The US Energy Information Administration’s 9 September forecast projected an average Brent price of about 90 US dollars per barrel in the second half of the year. That was an increase of 8 dollars, or roughly a tenth, from the previous forecast of 82 dollars. Model inputs were finalised on 3 September, so this revision cannot be attributed to later military statements. It is a forecast, not today’s exchange price. For hauliers and energy-importing industry, what matters is whether actual improvements in supply bring lower bills.
10 September: Europe chose higher interest rates
The European Central Bank decided to raise all three key interest rates by 0.25 percentage points. The deposit facility rate rose from 2.25% to 2.50% on 16 September. The decision has been made, but its effective date is not its announcement date.
In the bank’s forecasts, the energy shock remains an obstacle to returning inflation to its 2% target. That complicates conditions for companies facing higher fuel and borrowing costs at the same time. Banks’ interest income may rise, but weaker customers increase the risk of loan defaults. A central bank rate increase is therefore not equally good news for the entire financial sector.
11 September: annual inflation did not rise, but the monthly message was not reassuring
The US Consumer Price Index, or CPI, rose 3.4% year on year in August, the same as in July. The monthly change, adjusted for normal seasonal patterns, nevertheless accelerated from 0.1% to 0.4%. These data were already released on 11 September; this is not a future event.
The picture excluding food and energy is also mixed. Annual growth slowed from 2.5% to 2.4%, but monthly growth rose from 0.2% to 0.3%. It is therefore inaccurate to say that all price pressure intensified by the same amount. The central bank will have to consider both the pace in recent months and the broader trend.
How can annual inflation stay unchanged while monthly inflation rises?
The annual change compares the price level with the same month a year earlier. The monthly change compares two adjacent months. A new price increase can replace a similar older month, leaving the annual figure unchanged. The measure excluding food and energy helps show the direction of other prices, but does not capture a household’s whole bill.
? How should we read GDP and price indices?
Gross domestic product measures the value of final goods and services produced in an economy. Real growth removes the effect of prices. US quarterly growth is often reported at an annualised rate, as if the same change continued for four quarters. The Consumer Price Index measures a basket of prices weighted by consumption. Its annual and monthly changes have different comparison bases. The Personal Consumption Expenditures Price Index also includes spending made on consumers’ behalf, uses different weights and accounts for changes in the composition of consumption; these two price indices should not be treated as interchangeable.
11 September: the wait for an energy supply recovery grew longer
The International Energy Agency’s 11 September forecast projected a larger fall in oil supply than in demand this year. This is a forecast, not the final annual result.
France’s example: money is available, but it costs more
France’s ten-year government bond yield benchmark was 4.48% on 14 September, compared with 4.19% on 1 September. The move over these sessions is 0.29 percentage points; it is not a monthly investment return. The higher cost of new debt can increase the budget’s interest expense over time, but coupons on existing fixed-rate debt do not automatically change.

Professional portfolio management
A plan for your portfolio. No rush.
Let’s discuss your goals, risk tolerance and time horizon. Find out how your portfolio would be built and managed.
The first conversation is free, with no obligation.
30 days
What matters now
The priority now is to separate a friendlier discount rate from profit pressure
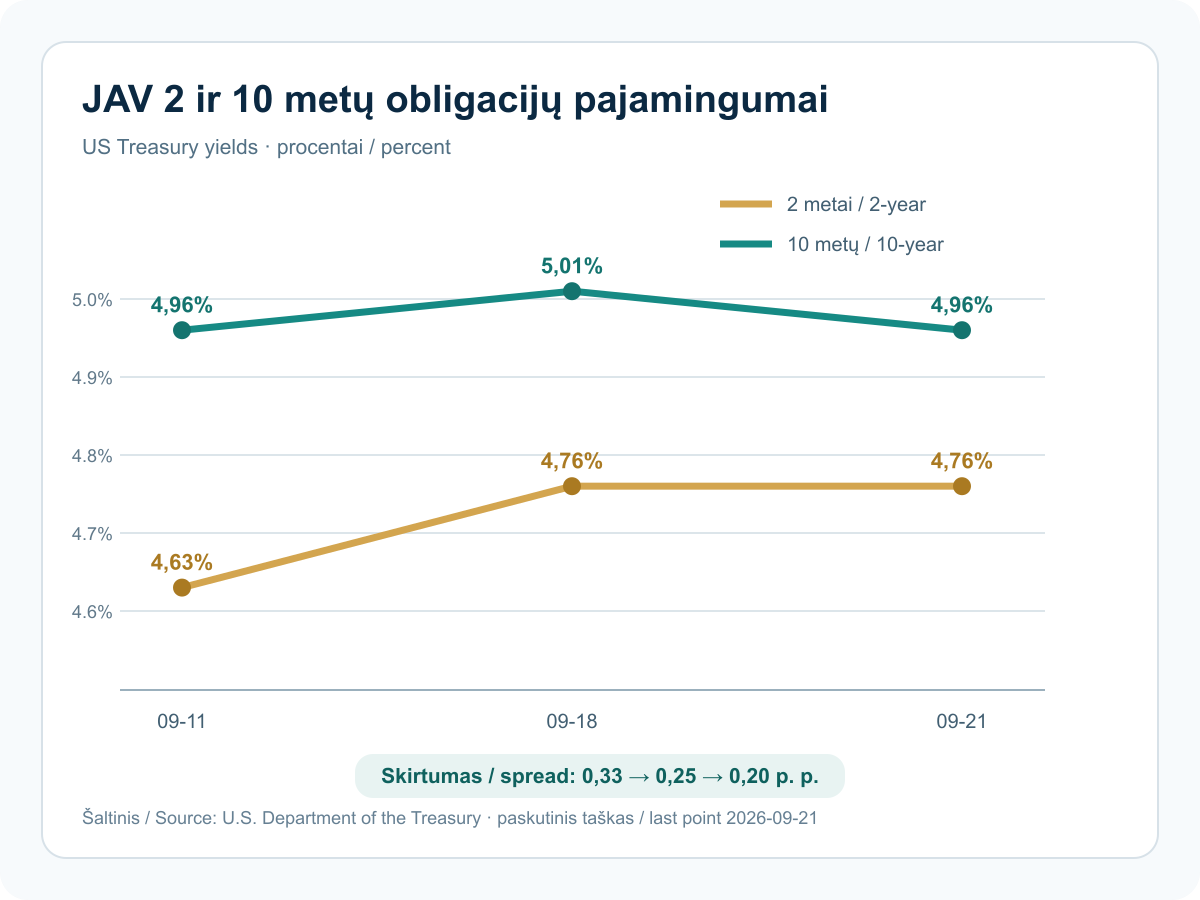
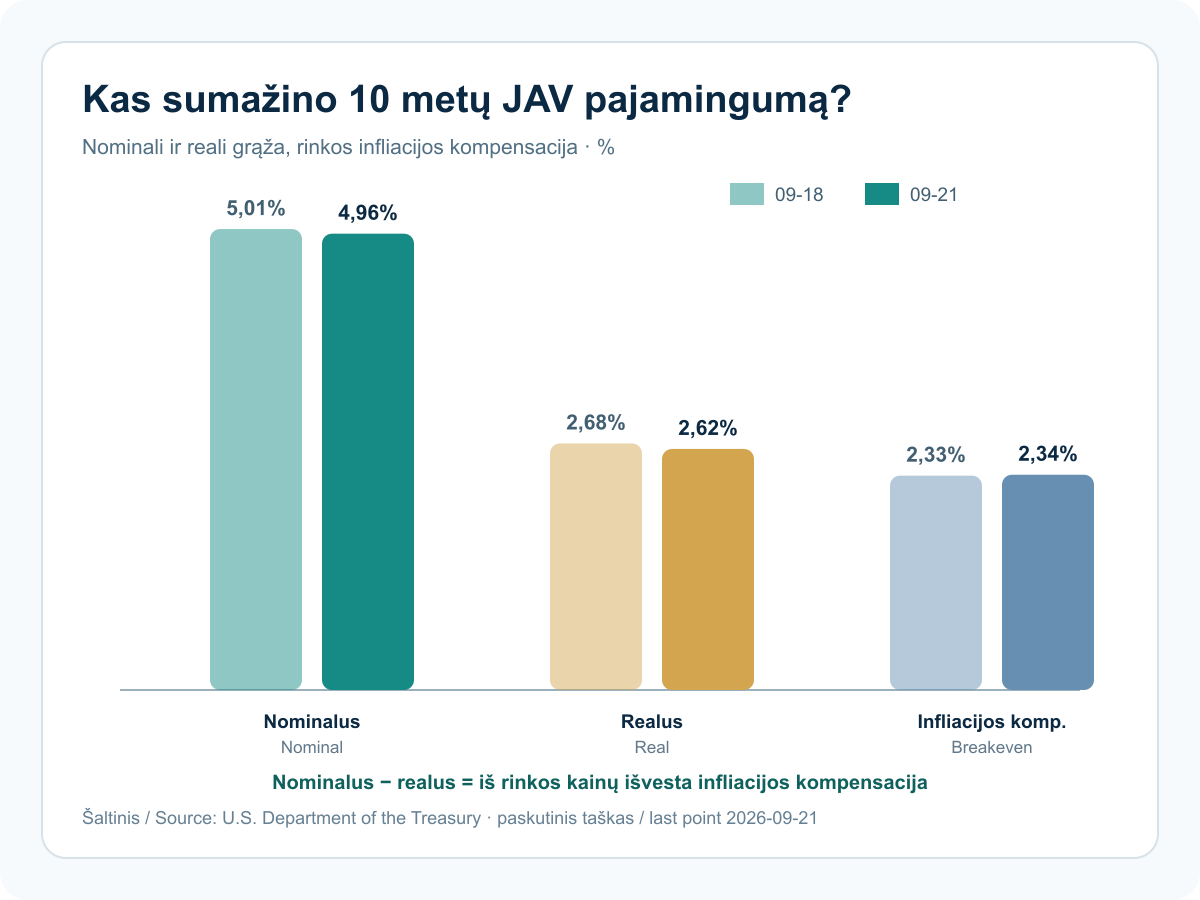
On 21 September, the long US yield fell while the two-year rate was unchanged. The ten-year real yield declined slightly more than the nominal yield, leaving implied inflation compensation almost unchanged. The combination is more supportive in the short term for long-duration bonds and equities whose value depends on distant earnings. It does not show that economic or price risk has ended.
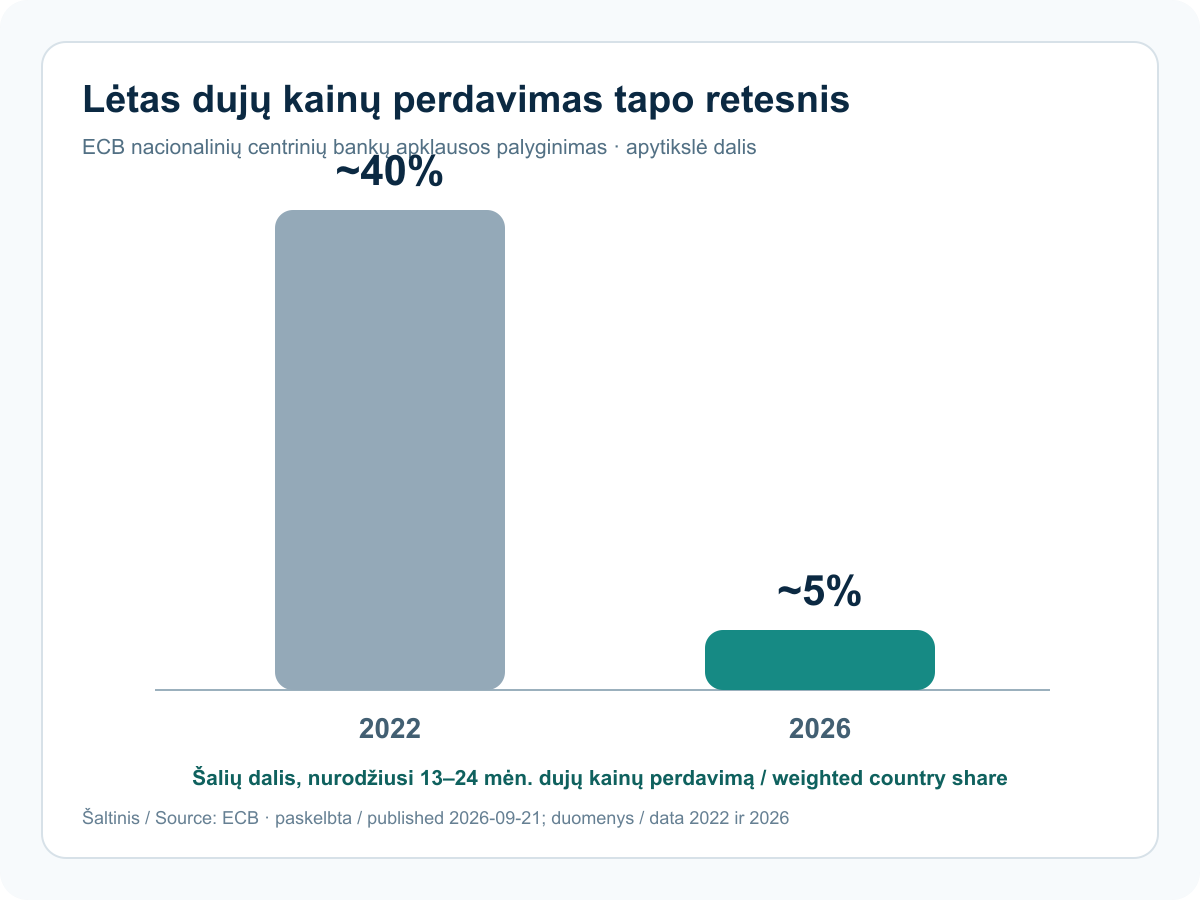
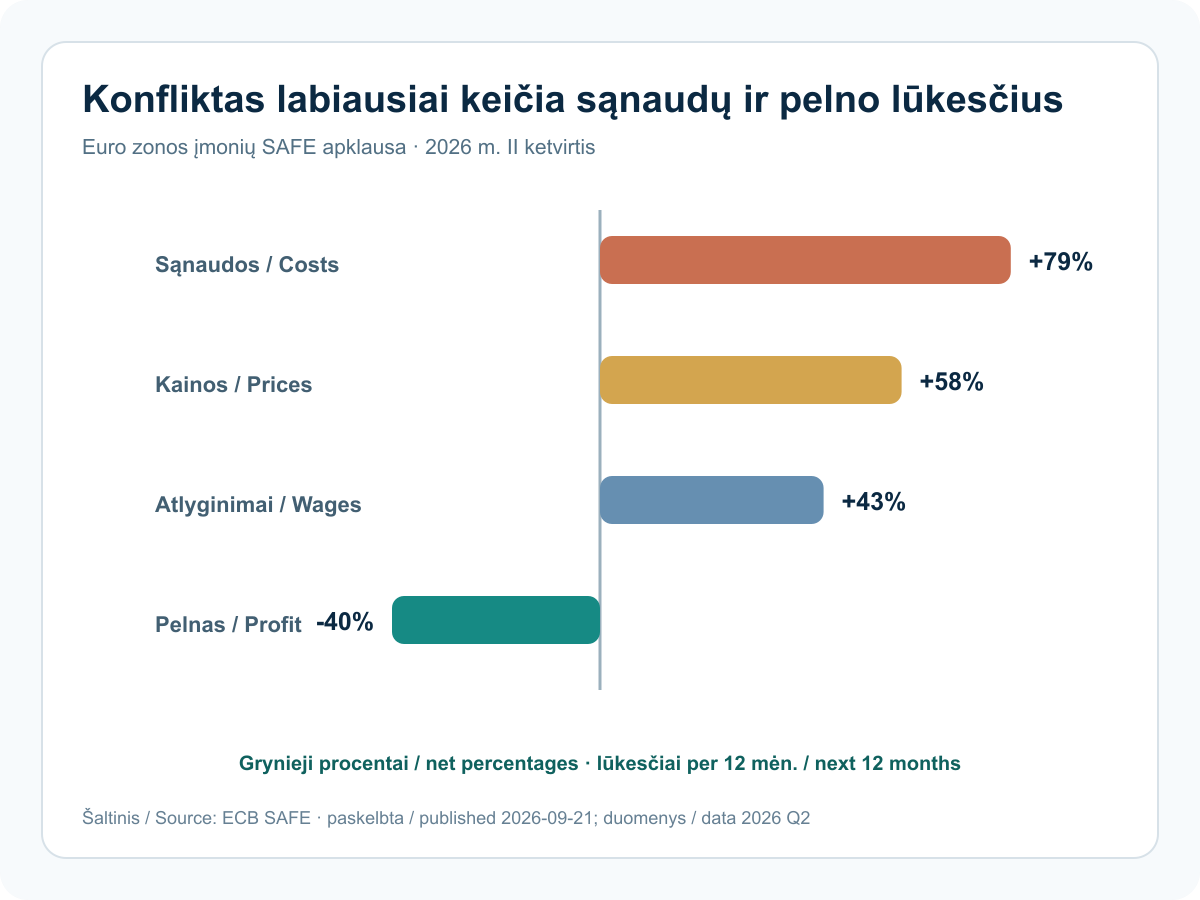
The ECB evidence explains the counterweight. A gas-price shock can now reach consumers faster, while companies more often expect higher costs and wages than higher profit. An asset’s rate-sensitive valuation can therefore improve at the same time as some company margins deteriorate. Pricing power, debt maturity and energy intensity matter more than the sector label alone.
South Korea’s KRW34.00 trillion operation illustrates a third channel: financial-system liquidity. It can stabilise short-term funding but does not answer whether final demand is growing. Bond portfolios need to compare duration with credit quality, equity portfolios margin with net debt, and multi-currency portfolios local returns with exchange-rate moves. The opportunity is a lower real return alongside resilient profit; the risk is faster energy pass-through alongside weaker demand.
? Why do the four charts show several channels rather than one forecast?
The curve shows the price of different maturities, the nominal-real gap separates real return from inflation compensation, the energy chart shows pass-through timing, and the company survey shows the direction of expectations. None of them alone forecasts the whole portfolio.
30 days
What comes next
What to watch
Japan’s new rate guideline takes effect on 24 September. South Korea’s 14-day liquidity operation matures on 6 October. US labour data and a new euro-area inflation estimate due on 2 October will test whether lower real yields can coexist with resilient demand. Actual company margins, rather than survey expectations alone, will change the longer-term conclusion: if profit withstands cost pressure, the friendlier discount rate will have firmer support; if not, the valuation relief may be brief.
Important. This is general market analysis, not a personal recommendation to buy or sell. Historical data and company results do not guarantee future returns. Forecasts and conditional scenarios may not materialise.
How is the history preserved and updated?
All five periods in this edition share one information date. Week means the latest 7 days, quarter means 90 days, and year means the trailing 12 months. The next dated edition will have a separate URL. This text keeps its date and assessment; later events are not silently inserted into an older edition. Longer periods assess new evidence alongside earlier developments without repeating every headline.