
Week · Market review
Week: US demand holds up as energy and borrowing costs rise
Information from 25 September to 1 October points to a clear contrast: US households and businesses are still spending, but financing and energy have not become cheaper. Releases at the end of the week added evidence about earlier months; they did not establish the final result for the third quarter.
Period covered: 2026-09-25 – 2026-10-01Information as of 8 min read
The 30 September releases included US spending and revised growth data, preliminary German and French inflation, and China’s factory survey. Long-term US Treasury yields ended the month above their August levels.
The US and euro-area policy rate increases made in September remain in effect. Strong sales can support company profits, but energy and new borrowing costs can absorb part of those profits.
Week
What happened
The week: new figures explained why business costs have not eased
US equipment orders and consumer sentiment released on 25 September pointed in different directions: business investment plans held up better than household confidence. The US and Chinese tariff-relief lists announced on 27 September were not yet tariffs in force. Long-term US Treasury yields rose further on 28 September. The August spending figures released on 30 September provided a more direct measure of demand: households bought more despite no increase in their real income.
In Europe, preliminary German and French inflation releases explained the end of the week. Energy prices were rising faster in both countries. China’s manufacturing survey moved back above its expansion threshold, but new orders did not strengthen. Higher production and better profitability therefore need to be assessed separately.
US spending grew, but household income did not rise after inflation
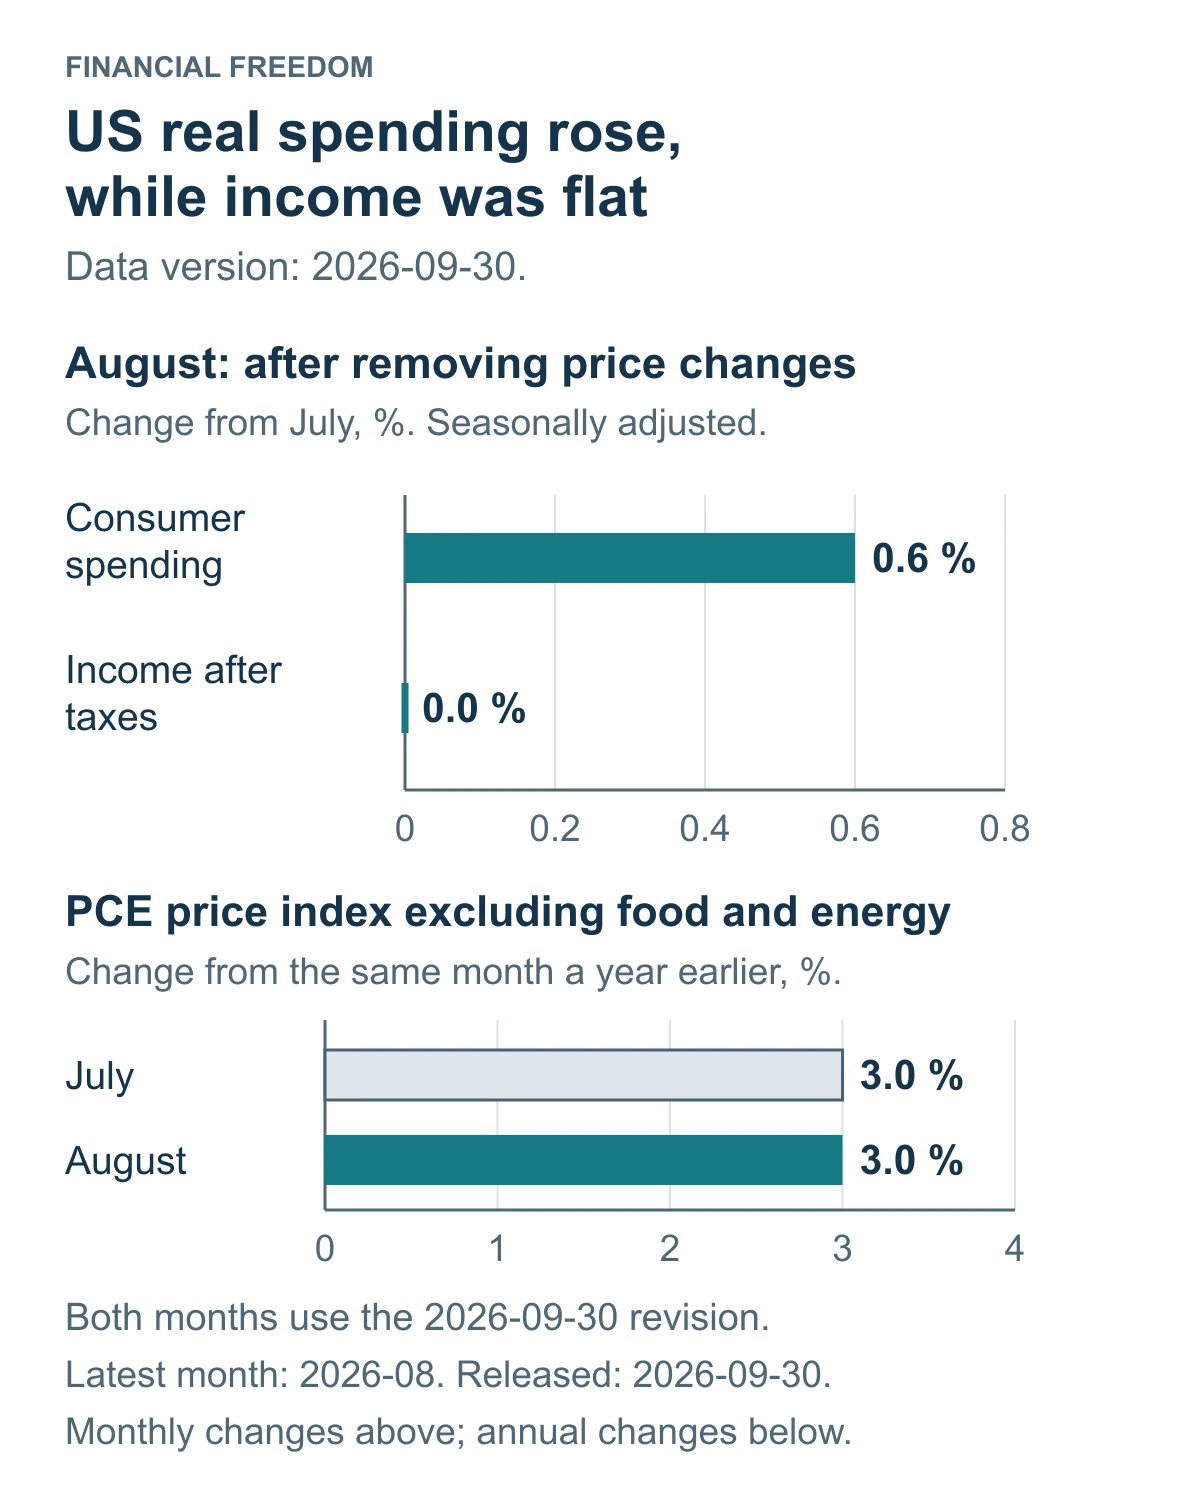
US household spending supported economic growth in August. On 30 September, the Bureau of Economic Analysis reported that spending increased by 0.6% over the month after removing price changes. However, inflation-adjusted disposable income was unchanged. The increase in spending was therefore not matched by growth in current income. Wages, savings and access to credit will matter for whether households can sustain that pace.
The price figures did not show a fresh decline in annual inflation. In the data revised on 30 September, the Personal Consumption Expenditures Price Index was 3.4% higher in August than a year earlier; excluding food and energy, the increase was 3.0%. July’s figures in the same revised series were identical. Comparing July’s earlier published estimate with August’s new figure would confuse a change in historical estimates with a change in prices.
? Personal Consumption Expenditures Price Index: what does it measure?
The index, known as PCE, measures changes in prices of goods and services bought for consumers, including some spending on their behalf. Excluding food and energy helps separate frequently volatile prices; 3.0% is annual price growth, not a monthly change or growth in the quantity consumed.
The same agency revised second-quarter real gross domestic product growth from a 1.5% to a 2.2% annualised rate, or roughly 0.6% over the quarter. Higher investment and spending estimates indicate firmer demand in April–June. This was not a September growth surge: the first estimate for July–September will be published on 29 October.
The US ten-year yield rose from 4.75% to 5.29% during September
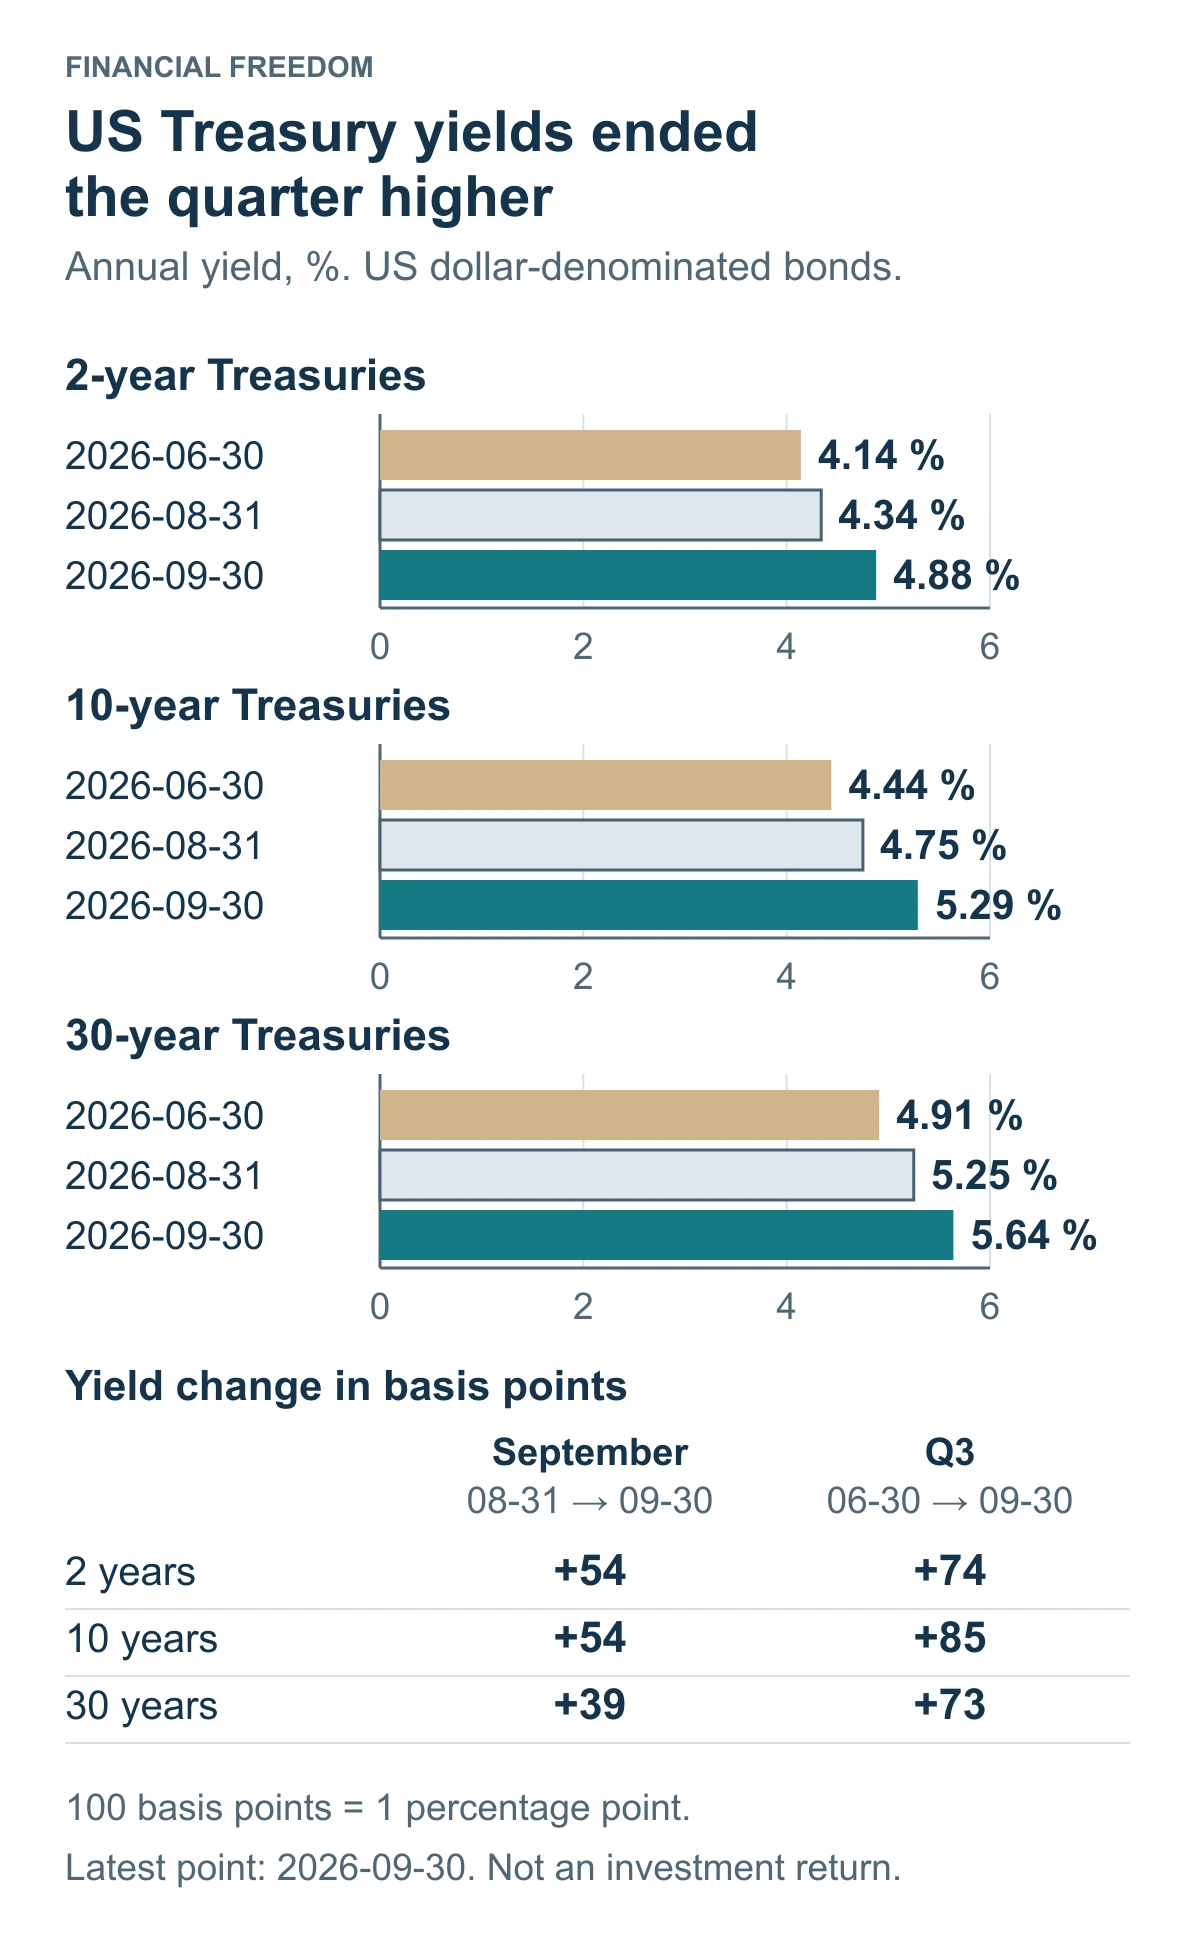
Long-term US borrowing costs increased during September. The ten-year Treasury yield stood at 5.29% on 30 September, compared with 4.75% on 31 August, a rise of 0.54 percentage points. Its increase on 30 September alone was 0.03 percentage points. The whole month’s rise cannot be attributed to yesterday’s consumer-spending release.
? Yields and basis points: how should the change be read?
The US Treasury table gives a standardised annual yield for each maturity. One basis point is 0.01 percentage points, so an increase of 0.54 percentage points equals 54 basis points. This is not an investment return: when yields rise, the price of an existing fixed-rate bond generally falls.
For your investments
Let’s discuss your portfolio
 FINANCIAL FREEDOM01 / 04
Investment results since 1999
Are you beating
global equities?

at the end of the period
Jan 1999–Jun 2026 · EUR · Cumulative return, %
Linear scale · * MSCI World → MSCI ACWI.
Past performance does not guarantee future returns.
FINANCIAL FREEDOM02 / 04Historical comparison
How far did it fall?
How long to recover?
Decline from the previous high

Longest recovery to the previous high

Jan 1999–Jun 2026 · EUR · Monthly data
* MSCI World → MSCI ACWI.
Past performance does not guarantee future returns.
FINANCIAL FREEDOM03 / 04Personal investment consultation
Already investing?
Let’s review your portfolio.
Yet to start
investing?
Let’s build your first
investment plan.
FINANCIAL FREEDOM04 / 04
Personal investment
consultation
Martynas
Juška
Investment manager
Managing a portfolio
of more than€100 million
German energy prices are rising faster, but other prices are not accelerating uniformly
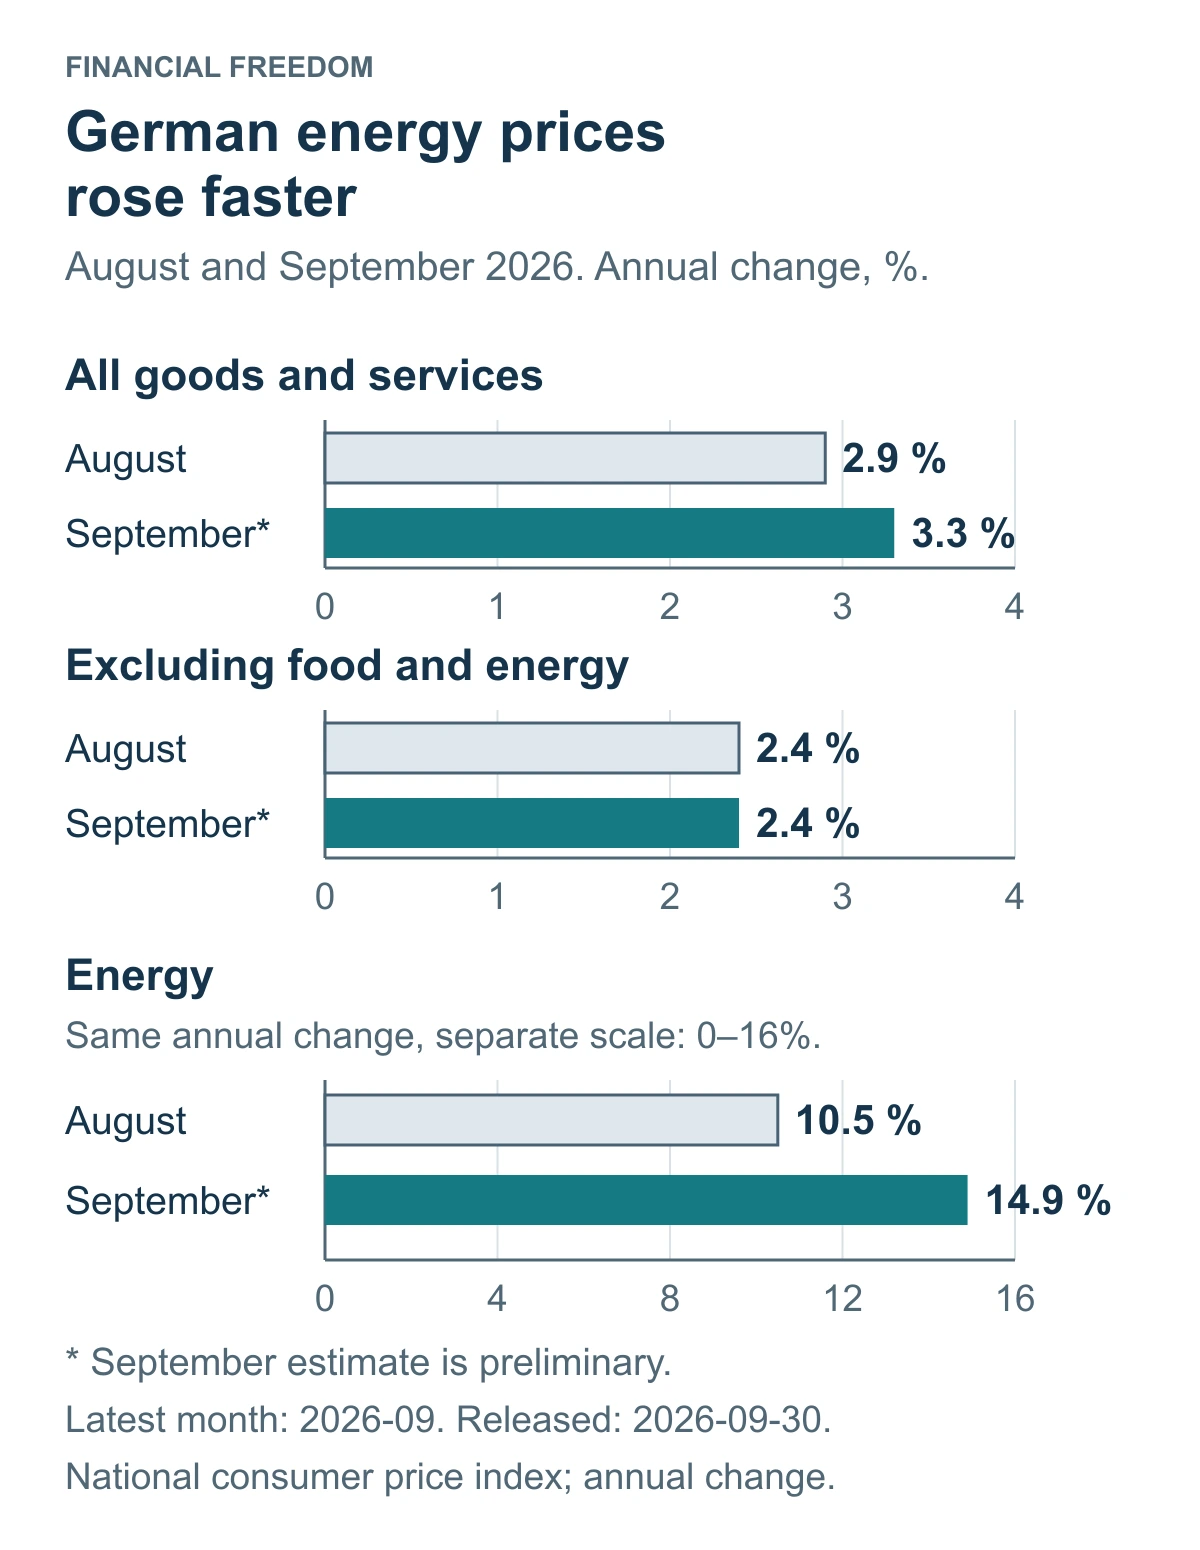
On 30 September, Germany’s statistical office estimated annual September inflation at 3.3%, up from 2.9% in August. Energy inflation accelerated from 10.5% to 14.9%. However, annual price growth excluding food and energy remained at 2.4%, while services inflation slowed from 2.8% to 2.7%. A higher headline rate does not mean that all costs have started rising faster.
France’s preliminary September inflation measured under the common European Union methodology, released the same day, rose from 2.6% to 3.4%. European Central Bank Executive Board member Isabel Schnabel stressed the impact of higher energy prices on other prices and expectations on 30 September. This was a new assessment, not a new interest-rate decision: the 2.50% deposit rate has been in effect since 16 September.
? Harmonised Index of Consumer Prices: why can it differ?
The Harmonised Index of Consumer Prices allows price growth across European Union countries to be compared under a common methodology. Its coverage and weights can differ from the national index, so France’s 3.4% figure here is not its national-index reading.
Chinese manufacturing recovers, but orders and profits are different measures
China’s National Bureau of Statistics reported on 30 September that its manufacturing Purchasing Managers’ Index, or PMI, rose from 49.8 to 50.1 in September. The production index strengthened to 51.7, but the new-orders reading edged down from 50.6 to 50.5. Companies increased production, yet the survey did not show a broader acceleration in orders.
? Purchasing Managers’ Index: why does 50 matter?
The business survey compares activity with the previous month. A reading above 50 generally indicates expansion, while one below 50 indicates contraction. A reading of 50.1 does not mean production grew by 50.1%; the input-price survey index is likewise not the percentage increase in actual prices.
The raw-material purchase-price index meanwhile rose from 56.6 to 60.8. This is an important qualification to the stronger production reading: producing more does not necessarily mean earning more. Chinese industrial businesses need to cover higher costs, while European equipment and materials suppliers need actual new orders, not just higher output at their customers.
US crude stocks rose, but finished-fuel inventories fell
On 30 September, the US Energy Information Administration released inventories for the week ending 25 September. Commercial crude stocks stood at 427.3 million barrels, 2.6% above the comparable week a year earlier. Petrol inventories, however, were 7.4% lower and distillates, including diesel and heating products, were 14.9% lower. All three percentages use the same year-on-year comparison principle.
This distinction matters for transport and industrial companies: crude in storage is not yet fuel delivered to a driver. If refineries process less crude, fuel availability can remain constrained even as crude inventories rise. That could support refiners’ selling prices while increasing hauliers’ fuel bills; actual prices and company profits still need to be assessed separately.

Investment consultation
Do your investments work together?
Review where your money is invested, how much depends on a single market and whether your plan fits your goals. Leave with clearer next steps.
See the consultation process and terms on the registration page.
Week
What matters now
A bond buyer and a company refinancing a loan face different opportunities
For a new US bond buyer, a higher yield offers the prospect of more future income. The same change is adverse for the prices of existing long-term fixed-rate bonds. Property businesses, utilities and companies building infrastructure with borrowed funds may face more expensive new financing. Payments on previously agreed fixed-rate loans do not automatically change as a result.
Stronger consumer spending supports revenue at US retailers and service businesses. The risk would increase if household income continued to stagnate and spending had to be cut. In Europe, chemical and transport companies paying more for energy face the opposite pressure: the same sales can leave less profit. October’s labour-market and price releases will help establish which force is gaining strength.
September’s dollar effect for euro investors differed from the full quarter
At the European Central Bank’s reference rates, one euro bought 1.1596 US dollars on 31 August and 1.1355 on 30 September. The euro weakened by 2.08% during September. If an asset’s dollar value had stayed entirely unchanged, its euro value would have risen by about 2.12% from currency conversion alone, before costs and without currency hedging. That is a separate exchange-rate effect, not the return on US shares.
The full-third-quarter currency effect was much smaller: from the 30 June rate of 1.1394 to 30 September, translating an unchanged dollar asset value into euros would have added about 0.34%. September’s result therefore cannot simply be applied to the whole quarter. A stronger dollar helped a euro investor holding unhedged US assets this month, but a later euro recovery could reverse that effect.
Week
What comes next
- 2 October: the US September employment report. Changes in employee numbers and wages will help assess whether household income can continue to support spending.
- 7 October: US weekly fuel inventories; 14 October: September consumer prices. The question is whether finished-fuel stocks continue to fall and whether higher energy costs affect a broader range of prices.
- 28–29 October: central bank decisions and US growth data. The US central bank decision is scheduled for 28 October; the ECB decision and the first US third-quarter growth estimate for 29 October. These will allow investors to assess actual quarterly growth and the banks’ responses to the new data.
Important. This is general market analysis, not a personal recommendation to buy or sell. Historical data and company results do not guarantee future returns. Forecasts and conditional scenarios may not materialise.
How is the history preserved and updated?
All five periods in this edition share one information date. Week means the latest 7 days, quarter means 90 days, and year means the trailing 12 months. The next dated edition will have a separate URL. This text keeps its date and assessment; later events are not silently inserted into an older edition. Longer periods assess new evidence alongside earlier developments without repeating every headline.