
Week · Market review
Week: orders hold up as credit and materials cost more
Data released from 26 September to 2 October showed resilient US demand, but more expensive materials and some new loans increased costs for companies and households. The fall in US Treasury yields on 1 October interrupted the earlier rise without reversing September’s trend. This is a rolling seven-day review up to the data cutoff, not the result of an already completed Friday trading session.
Period covered: 2026-09-26 – 2026-10-02Information as of 7 min read
On 1 October, the US manufacturing survey showed stronger new orders and greater input-price pressure, while Treasury yields fell. Euro-area August lending figures and second-quarter house-price data were released on the same day.
The US and euro-area central bank rate increases made in September remain in effect. One session’s move in US bond yields does not automatically reduce households’ or businesses’ existing loan payments.
Week
What happened
The week: demand held up, while costs rose unevenly
The US and China published lists of products proposed for tariff relief on 27 September. The US list includes plastic tableware and bedding imported from China, while China’s list includes US beef and dairy products, but publication did not itself reduce tariffs. The slower annual growth in Chinese industrial profits reported on 28 September underlined that producing more and earning more are different things. US figures released on 30 September showed higher consumer spending in August despite no increase in real household income.
Preliminary price figures published by Germany and France on 30 September showed faster September inflation; energy drove the German increase. Euro-area lending figures released on 1 October added another household cost: the price of new credit in August. US Treasury yields fell that day. The week’s conclusion up to Friday’s data cutoff remains conditional: stronger orders support sales, but higher costs can reduce the profits left from those sales.
US factory orders expanded, but input prices rose too
The Institute for Supply Management’s US manufacturing survey, released on 1 October, showed continued sector expansion in September. Its Manufacturing Purchasing Managers’ Index, or PMI, was 54.5, compared with 54.6 in August. The broad growth signal was therefore almost unchanged.
A more important contrast emerged within the survey. The new-orders index rose from 53.7 to 55.3, while the prices-paid index increased from 71.1 to 77.9. Stronger orders can support manufacturers’ sales, but more expensive materials can reduce profit if a company cannot raise selling prices or cut other costs.
? Purchasing Managers’ Index: why does 50 matter?
The survey compares business conditions with the previous month: a reading above 50 generally indicates expansion and one below 50 contraction. The separate orders and prices-paid readings are not percentage changes in orders or prices.
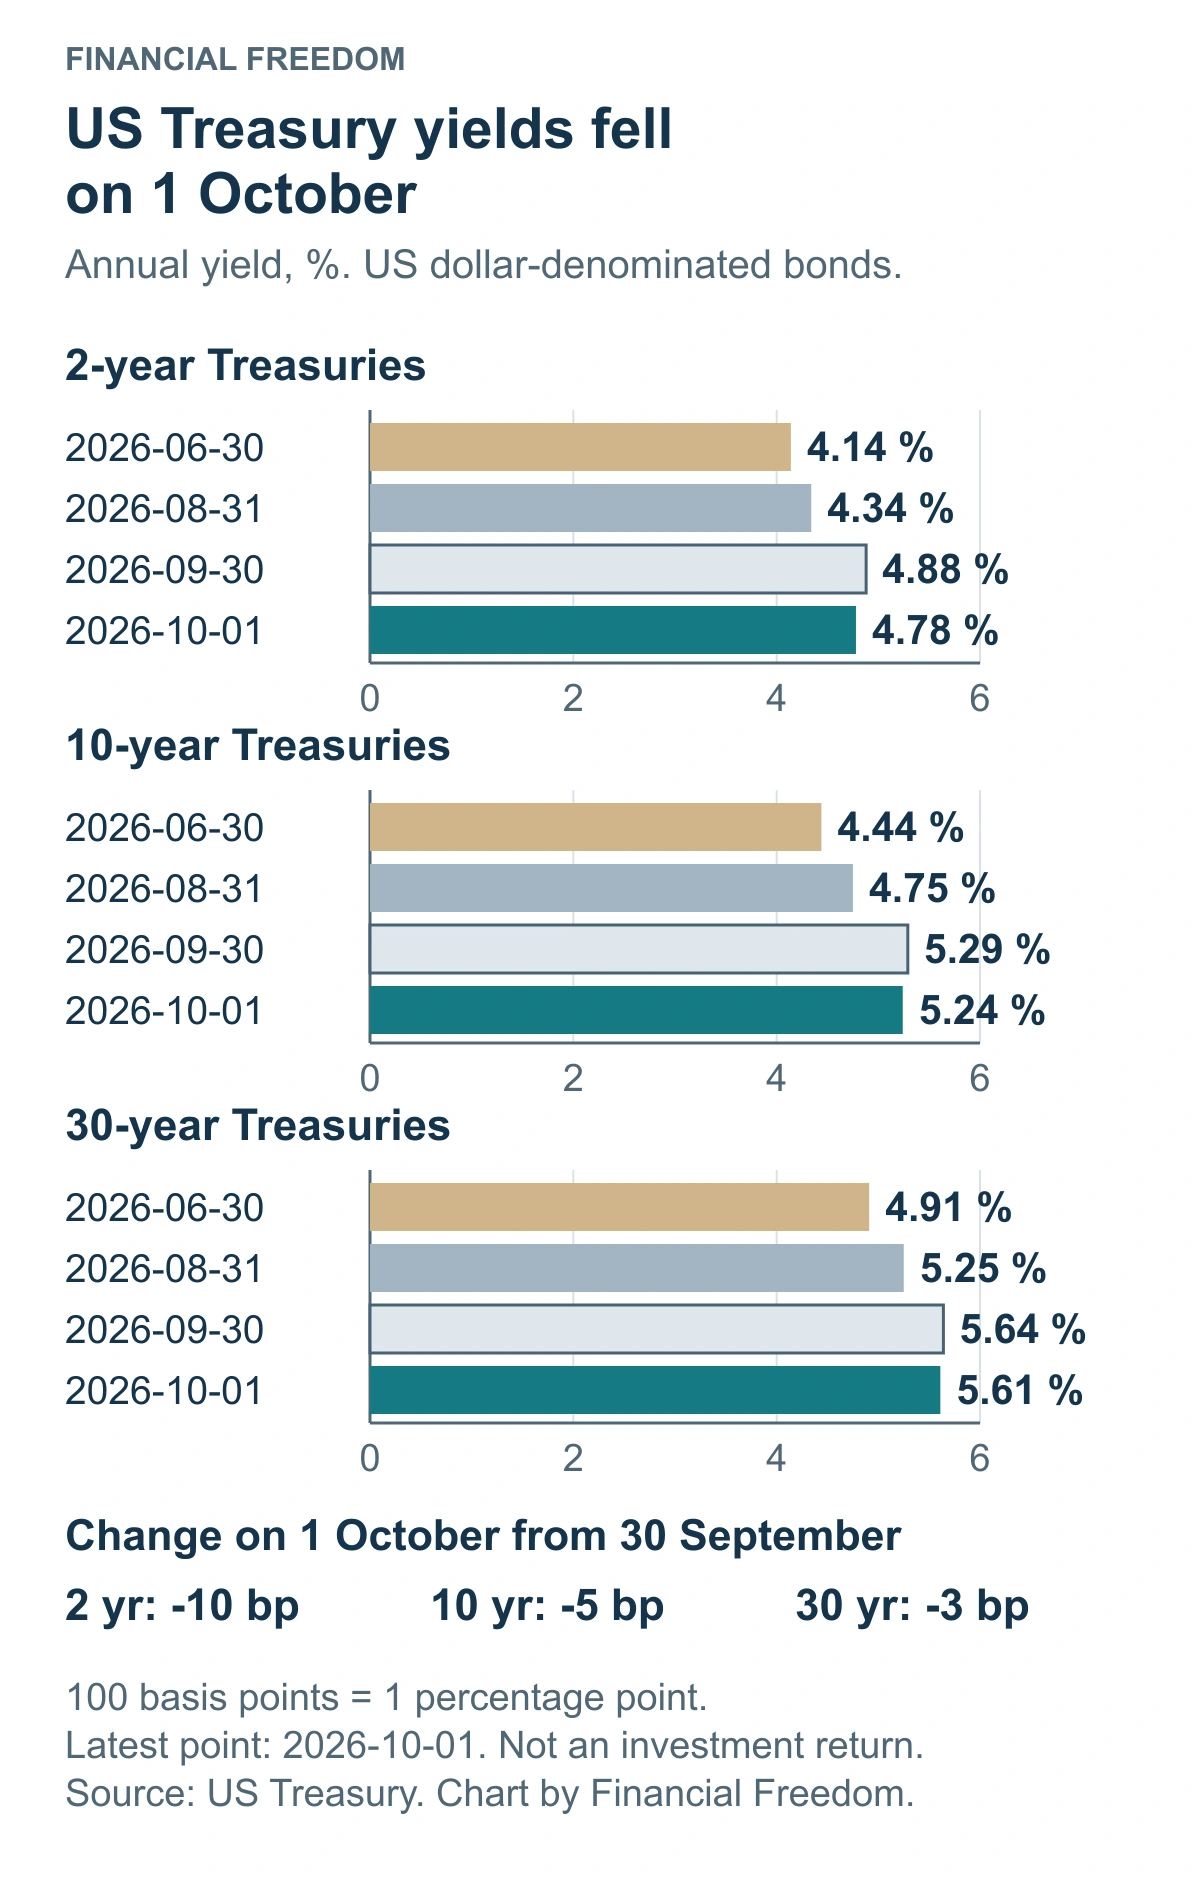
US Treasury data show that the ten-year yield fell from 5.29% to 5.24% on 1 October. The two-year yield declined from 4.88% to 4.78%, and the thirty-year yield from 5.64% to 5.61%. The shorter maturity had the larger fall, but one day’s move does not establish where interest rates will be a month later.
? Yields and basis points: how should the change be read?
The US Treasury measure is a standardised annual government-bond yield for a given maturity, calculated from market quotations. One basis point is 0.01 percentage points. This is not the coupon or daily return; falling yields generally support existing fixed-rate bond prices.
For your investments
Let’s discuss your portfolio
 FINANCIAL FREEDOM01 / 04
Investment results since 1999
Are you beating
global equities?

at the end of the period
Jan 1999–Jun 2026 · EUR · Cumulative return, %
Linear scale · * MSCI World → MSCI ACWI.
Past performance does not guarantee future returns.
FINANCIAL FREEDOM02 / 04Historical comparison
How far did it fall?
How long to recover?
Decline from the previous high

Longest recovery to the previous high

Jan 1999–Jun 2026 · EUR · Monthly data
* MSCI World → MSCI ACWI.
Past performance does not guarantee future returns.
FINANCIAL FREEDOM03 / 04Personal investment consultation
Already investing?
Let’s review your portfolio.
Yet to start
investing?
Let’s build your first
investment plan.
FINANCIAL FREEDOM04 / 04
Personal investment
consultation
Martynas
Juška
Investment manager
Managing a portfolio
of more than€100 million
France borrowed almost €12 billion, but its bonds carry different interest costs
France’s debt agency allocated €11.999 billion of long-term bonds at the initial auction on 1 October, with settlement scheduled for 5 October. The largest share, €6.271 billion, was the issue maturing on 25 November 2036. Its average auction yield was 4.93%, although the annual coupon is 3.70%: buyers purchased the bond below its face value.
? Coupon and yield: why are they different?
The coupon is calculated from a bond’s face value, whereas the yield also takes account of its purchase price and repayment at maturity. Buying below face value can produce a yield above the coupon if payments are made and the bond is held to maturity.
This is the auction result for a particular issue, not the daily move in the entire French ten-year government-bond market. The 2027 funding plan published on 29 September envisaged greater borrowing needs, partly to redeem old bonds. Investors must absorb the additional bond supply, making the interest compensation they require important to the state. For holders of French bonds this poses a price risk; for new buyers it offers an opportunity to weigh the income against the state’s finances.
Euro-area mortgages and consumer credit became more expensive in August
On 1 October, the European Central Bank published August statistics on new bank lending. The euro-area mortgage rate indicator rose by 0.06 percentage points to 3.60%, while the consumer credit rate increased by 0.33 percentage points to 7.92%. The corporate borrowing cost indicator was almost unchanged at 3.77%. These are euro-area averages, not an offer from an individual Lithuanian bank; August figures do not yet show the effect of the ECB’s September rate increase.
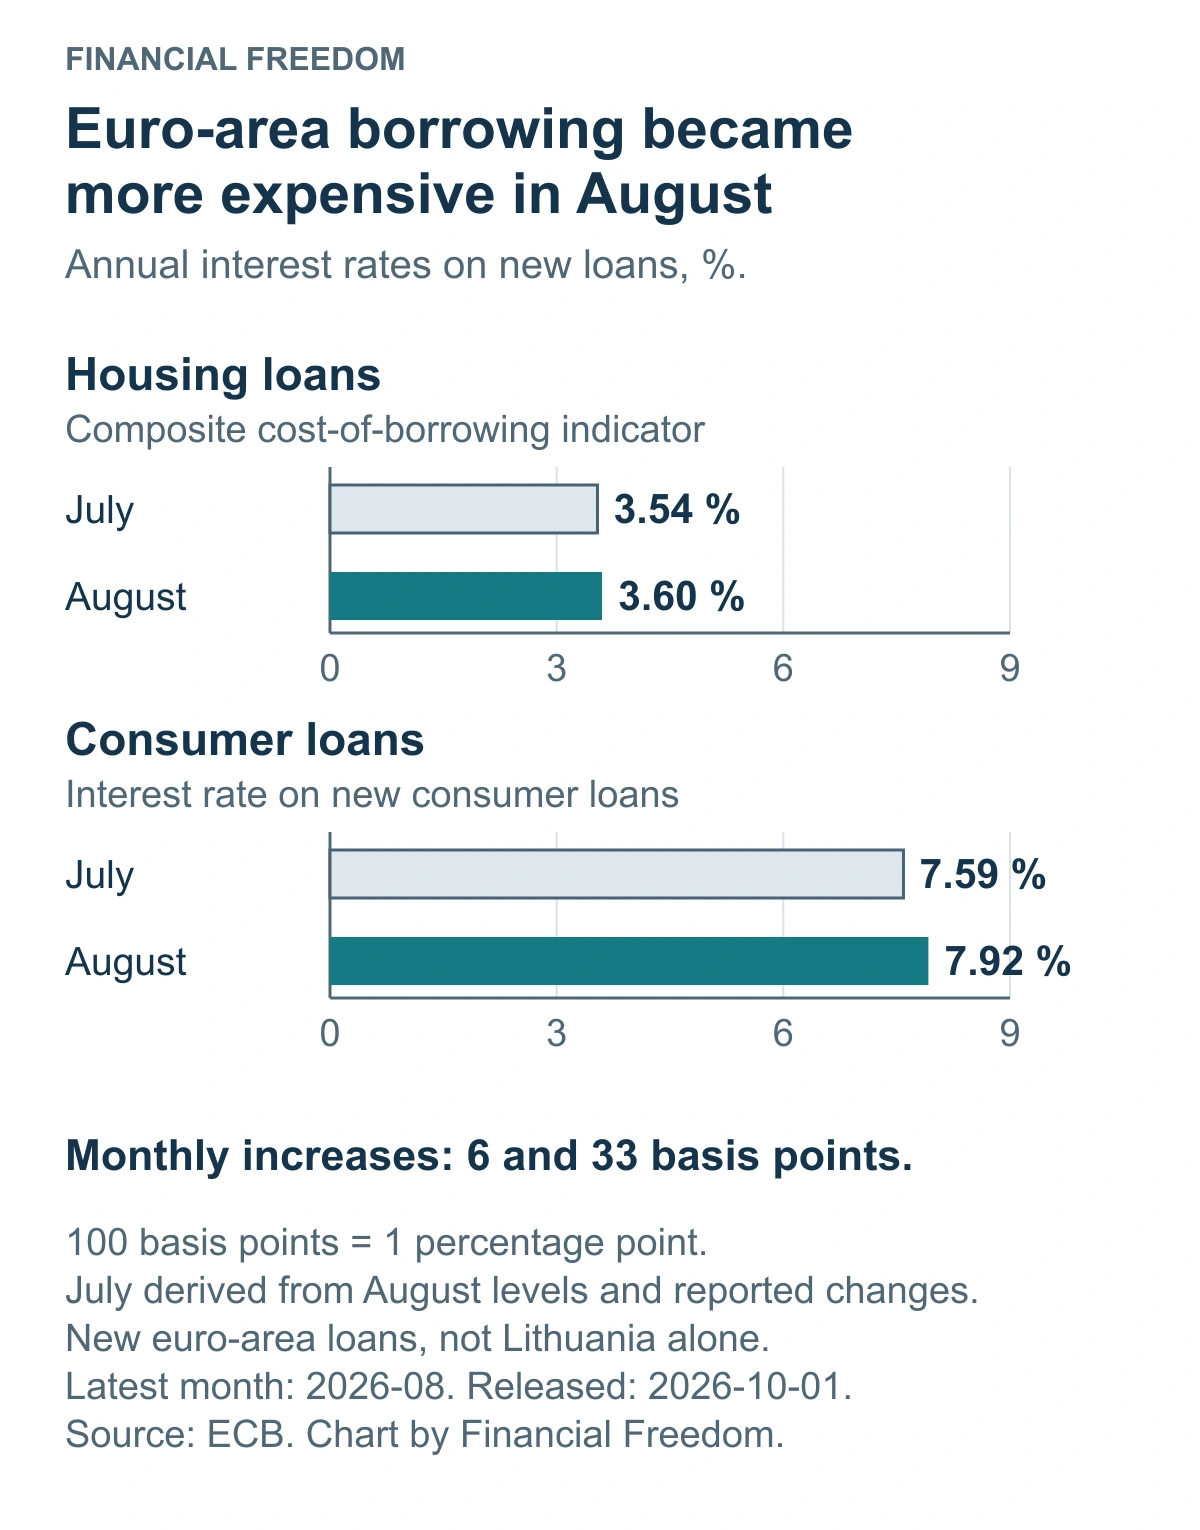
For a home buyer, a higher interest rate means a larger payment on an otherwise identical new loan, with its size and term unchanged. More expensive consumer credit reduces households’ ability to finance spending through borrowing. That can mean more cautious customers for retailers and higher income from new lending for banks, alongside a greater risk that some borrowers struggle with repayments.
? New lending rates: whose borrowing costs do they describe?
These banking statistics summarise new agreements and their weights across the euro area, rather than interest rates on all outstanding loans. An individual offer depends on the country, loan terms and borrower; changes in the mix of agreements can also affect the monthly average.
Lithuanian house prices rose much faster than the euro-area average
On 1 October, Eurostat reported that Lithuanian house prices were 14.3% higher year on year in the second quarter and 5.0% above the first quarter. The corresponding euro-area changes were 4.0% and 1.1%. These are transaction-price data for April–June, not October asking prices.

Someone buying a home in Lithuania needs to consider both its price and the future mortgage payment. However, second-quarter house-price growth cannot be explained by euro-area lending rates observed later, in August. For an owner, a price increase is not yet a net gain: loan interest, maintenance, taxes and purchase and sale expenses affect the result.
? House Price Index: what does it cover?
The index measures transaction-price changes in new and existing residential properties purchased by households; neither inflation nor seasonal effects are removed here. It is not a rental yield or a return on all types of property. Annual and quarterly changes use different comparison periods.

Professional portfolio management
A plan for your portfolio. No rush.
Let’s discuss your goals, risk tolerance and time horizon. Find out how your portfolio would be built and managed.
The first conversation is free, with no obligation.
Week
What matters now
Debt maturities and portfolio concentration matter more than one daily figure
Falling yields generally help holders of long-term fixed-rate bonds, while reducing the income offered on newly purchased bonds. For a highly indebted property business or utility, the important question is when an old loan must be repaid and replaced. Payments on an existing fixed-rate loan do not automatically change when market yields move.
Stronger orders give industrial companies an opportunity to increase sales. Greater risk falls on those unable to pass higher material costs on to customers. For bank and consumer-company shares, meanwhile, an important question is whether households can afford higher repayments without cutting other spending. New wage, loan-quality and company-profit figures will help test those conditions.
The Lithuanian house-price comparison is particularly relevant to an investor whose assets are concentrated in one property or country. A rising property value can increase total wealth, but it does not provide the same ready access to cash as easily sold investments. Comparing housing with shares or bonds requires matching periods and currencies and including all income and costs, rather than considering the price index alone.
Week
What comes next
- 2 October: the US September employment report. It was still due at the edition’s data cutoff. Employee numbers and wages will help assess whether household income can support spending.
- 7 October: US weekly fuel inventories; 14 October: consumer prices. These releases will show whether constrained fuel supply continues to affect costs and whether price pressures are spreading.
- 28–29 October: central bank decisions and US growth data. The US decision is scheduled for 28 October; the ECB decision and first US third-quarter growth estimate for 29 October. They will help test whether demand remained resilient and whether the banks are changing their interest-rate direction.
Important. This is general market analysis, not a personal recommendation to buy or sell. Historical data and company results do not guarantee future returns. Forecasts and conditional scenarios may not materialise.
How is the history preserved and updated?
All five periods in this edition share one information date. Week means the latest 7 days, quarter means 90 days, and year means the trailing 12 months. The next dated edition will have a separate URL. This text keeps its date and assessment; later events are not silently inserted into an older edition. Longer periods assess new evidence alongside earlier developments without repeating every headline.