
Week · Market review
Week: Asia’s equity shock and an uneven rebound
On 20 October, Japanese shares fell again after the previous day’s rebound in US technology. A week in which South Korea’s exchange halted trading highlighted shared technology exposure across different funds. Economic data provided a counterweight, but stronger production did not mean a broad consumer recovery.
Period covered: 2026-10-14 – 2026-10-20Information as of 7 min read
After Korea’s trading pauses on 15 October, US and Japanese equities diverged. China’s data showed stronger production than consumer spending, while Canadian inflation excluding petrol slowed.
A trading pause does not guarantee recovery, and one better economic indicator does not remove the effects of expensive fuel and weak demand on corporate profits.
Week
What happened
14–16 October: expensive fuel and Asia’s sell-off changed the week’s risk assessment
On 14 October, the US Bureau of Labor Statistics reported that September consumer prices were 3.7% higher than a year earlier. Prices rose 0.6% from August after seasonal adjustment. Petrol became 9.1% more expensive over the month and accounted for more than half of the overall monthly increase. For households using a car, that is an additional expense leaving less money for other purchases.
Other goods and services also became more expensive, but more slowly. The basket excluding food and energy rose 0.3% over the month. Faster headline inflation therefore does not mean an identical increase in every company’s selling prices. Fuel sellers and retailers of clothing or household goods face different demand conditions and different opportunities to raise prices.
On 15 October, South Korea’s exchange separately announced twenty-minute trading halts in its main KOSPI market and the KOSDAQ market for smaller companies. In both cases, the index had fallen at least 8% from the previous close and remained beyond that threshold for a minute. These were pauses across the respective market, not restrictions on one company’s shares or on programme orders alone.
? Automatic trading halt: what does it change?
A large index move triggers a temporary pause under the exchange’s rules. Trades cannot be completed in the halted market during that pause. It guarantees neither a price recovery nor a sale at the last price seen before trading stopped.
On the same day, index provider MSCI opened a consultation on moving Indonesia from emerging-market to standalone-market status. This is a proposal, not a completed removal. Korea’s trading pause and Indonesia’s classification question are different events, but both show why regional equity investors need to consider the conditions under which they can sell holdings, alongside the companies’ businesses.
On 16 October, the Federal Reserve reported a 0.7% monthly increase in US real industrial production in September, with manufacturing up 0.3%. Europe’s release on 15 October covered an earlier month, August, and was weaker: euro-area industrial production fell 0.5%. The different measurement months mean this is not a like-for-like comparison of the same period across countries. Production was nevertheless not moving uniformly.
Korean shares fell despite the previous US rebound
On 20 October, South Korea’s main KOSPI index closed at 5,552.74 points, down 3.73% on the day. The KOSDAQ index fell 3.33% to 781.97 points. In its daily review compiled at 09:45 Lithuanian time, the exchange linked the KOSPI decline to concerns about artificial-intelligence profitability and financing, and the international situation. This is the exchange’s market interpretation, not proof that every seller had the same motive.
On 19 October, the US Nasdaq Composite equity index rose 1.11%, while the Nasdaq-100 index of large non-financial companies gained 1.17%. The PHLX Semiconductor index advanced 1.61%. These are results from the previous US trading day, not changes during the 20 October US session.
At 09:25 Lithuanian time on 20 October, Japan’s Nikkei 225 stood at 64,037.26 points, 1.35% below its previous close. The Nikkei Semiconductor Stock Index was down 2.82% at that point. These were intraday readings, not Japan’s final daily result. They show that companies in similar businesses were not moving in the same direction across markets that morning.
For your investments
Let’s discuss your portfolio
 FINANCIAL FREEDOM01 / 04
Investment results since 1999
Are you beating
global equities?

at the end of the period
Jan 1999–Jun 2026 · EUR · Cumulative return, %
Linear scale · * MSCI World → MSCI ACWI.
Past performance does not guarantee future returns.
FINANCIAL FREEDOM02 / 04Historical comparison
How far did it fall?
How long to recover?
Decline from the previous high

Longest recovery to the previous high

Jan 1999–Jun 2026 · EUR · Monthly data
* MSCI World → MSCI ACWI.
Past performance does not guarantee future returns.
FINANCIAL FREEDOM03 / 04Personal investment consultation
Already investing?
Let’s review your portfolio.
Yet to start
investing?
Let’s build your first
investment plan.
FINANCIAL FREEDOM04 / 04
Personal investment
consultation
Martynas
Juška
Investment manager
Managing a portfolio
of more than€100 million
Chinese production grew much faster than consumer sales
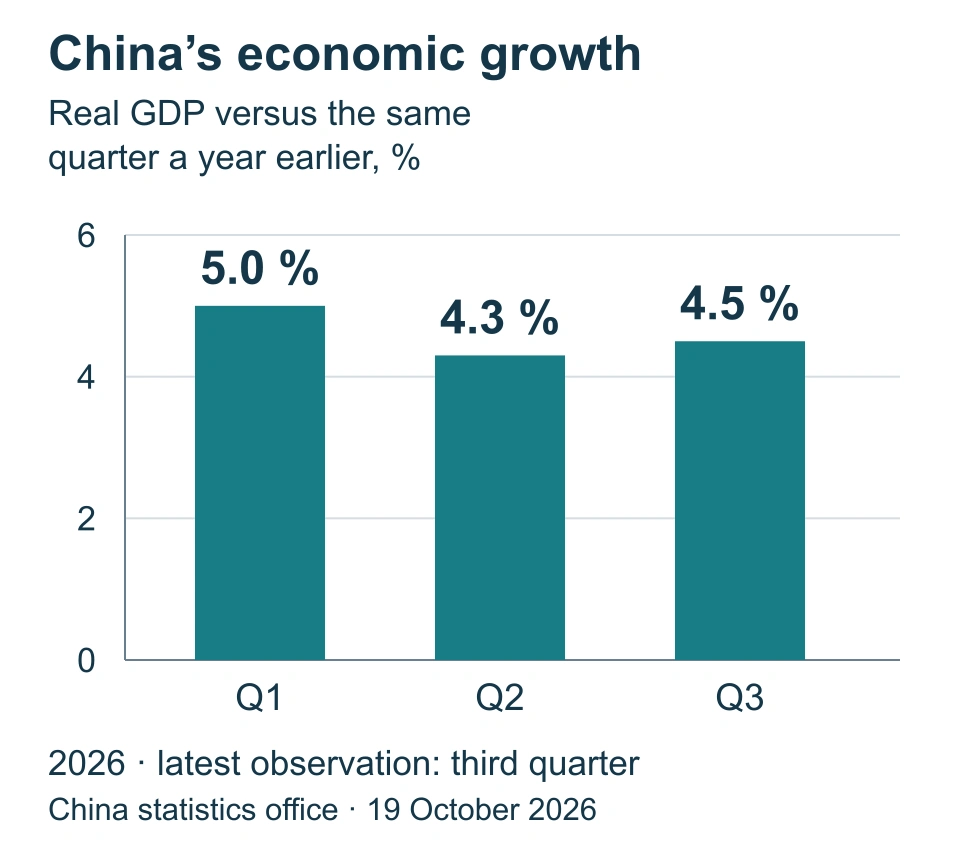
On 19 October, China’s statistics office reported that real gross domestic product in the third quarter was 4.5% higher than a year earlier. Growth had been 4.3% in the second quarter. In September, value added by industrial enterprises meeting the specified size threshold increased 5.5% year on year, but retail sales grew only 1.1%. Industrial value added is adjusted for price changes, whereas sales are reported at current prices; these are not identically calculated measures of volume.
Property exposed another weak part of domestic demand: investment in property development over January–September was 20.6% lower than a year earlier. This is a change in investment over nine months, not a September house-price decline. A shortage of construction orders can directly reduce revenues for suppliers of building materials and equipment.
On 20 October, China’s one-year loan prime rate was set at 3.0%, and the rate for loans over five years at 3.5%. These are reference rates used in bank loan pricing. An individual borrower’s interest rate also depends on the contract and the bank’s risk assessment, so neither figure is a loan price available equally to everyone.
Petrol pushed Canada’s headline price measure higher
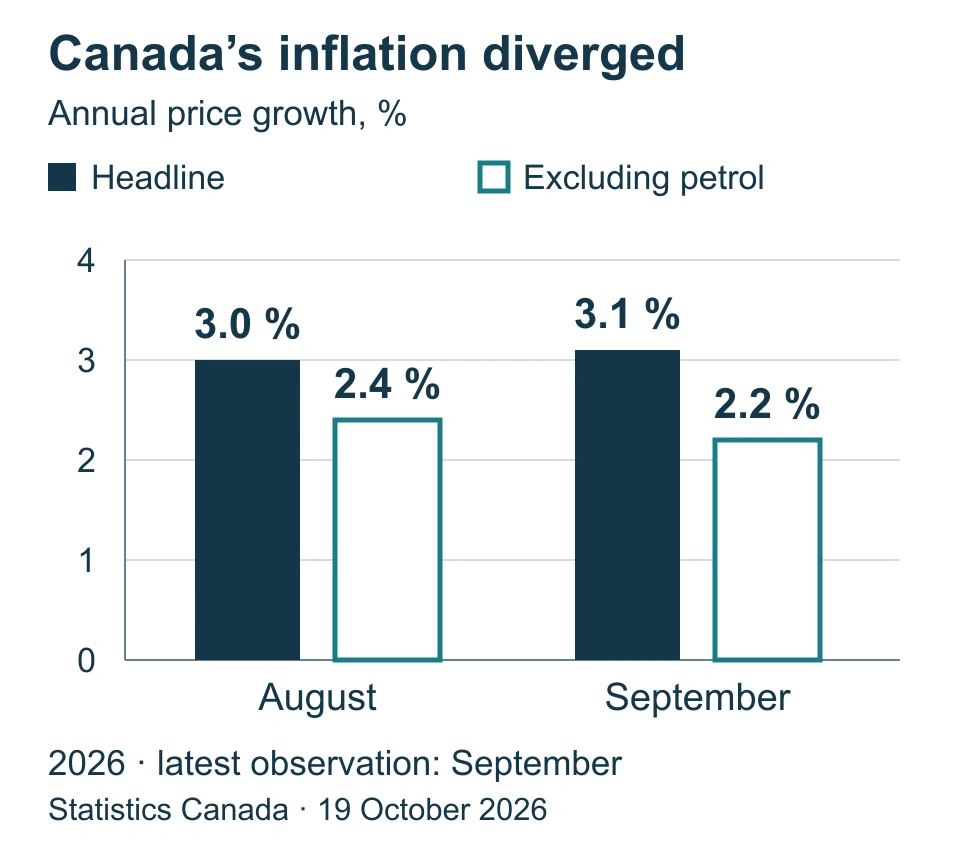
On 19 October, Statistics Canada reported that annual inflation in September had accelerated from 3.0% to 3.1%. Excluding petrol, however, price growth slowed from 2.4% to 2.2%. Petrol cost 27.8% more than a year earlier, compared with annual growth of 22.8% in August. The higher headline inflation rate therefore does not indicate uniformly stronger pressure across all prices.
? Annual inflation: which prices are being compared?
This compares a consumer price basket with the same month a year earlier, not with the previous month. The measure excluding petrol helps separate its influence but is not the same as a measure excluding all energy products.
Week
What matters now
Trading conditions are a separate portfolio risk
For a fund holding Korean shares directly, a trading pause can make it harder to sell assets when investors need cash. A broader Asian fund’s outcome depends on its actual country weights. Indonesia’s consultation is not an outflow that has already occurred: portfolio adjustments would depend on the final decision and its implementation.
Funds covering different regions can depend on the same customers
A portfolio holding US technology companies, Korean electronics businesses and Japanese semiconductor producers has a shared link to electronics and data-centre investment. When the same customers reduce orders, geographical diversity does not always mean different earnings risks. A Korean equity fund and a broader Asian fund will also depend on their individual company weights. An opportunity can arise where a lower share price accompanies firm orders and cash generation; a falling price alone does not establish that case.
Suppliers of industrial equipment to China may be in a different position from sellers of consumer goods or construction materials. The former depend on factory orders, while the latter need household purchases and new building activity. Someone assessing a Chinese equity fund or a European exporter should therefore ask which customers generate revenue, rather than rely only on the country’s headline economic growth rate.
More expensive fuel changes household spending and bond risks
For Canadian transport companies, petrol and other fuel prices matter through costs; for retailers, they matter through the money customers have left for discretionary purchases. Higher selling prices can help energy companies, but production, refining and financing costs still shape their profits. The overall consumer price index does not establish the profitability of each of these businesses.
For Canadian government bonds, the question is whether the central bank regards the petrol surge as temporary or sees it spreading to other prices. Expectations of higher interest rates for longer would put pressure on long-dated fixed-rate bond prices. Weaker demand would be a counterweight. For holdings without a currency hedge, changes in the Canadian dollar also affect the return measured in euros.
Week
What comes next
The UK releases September consumer prices on 21 October, followed by Japan’s national inflation figures for the same month on 23 October. Will energy prices and the rest of the consumer basket diverge as they did in Canada? The answer matters for both countries’ bonds and companies exposed to domestic consumer spending.
Indonesia’s classification process is longer: MSCI is seeking consultation responses by 30 April 2027 and expects a decision by 30 June. Those dates do not represent an index composition change that has already happened.
The US central bank meets on 27–28 October. Its decision will help show how it balances price pressures against economic activity and labour-market conditions.
On 28 October, the Bank of Canada will announce its interest-rate decision and an updated economic assessment. The main question is whether slowing price growth elsewhere will outweigh more expensive petrol.
Important. This is general market analysis, not a personal recommendation to buy or sell. Historical data and company results do not guarantee future returns. Forecasts and conditional scenarios may not materialise.
How is the history preserved and updated?
All five periods in this edition share one information date. Week means the latest 7 days, quarter means 90 days, and year means the trailing 12 months. The next dated edition will have a separate URL. This text keeps its date and assessment; later events are not silently inserted into an older edition. Longer periods assess new evidence alongside earlier developments without repeating every headline.