
Week · Market review
9–15 September: energy pressure and uneven growth
Over these seven days, it became clearer why economic growth alone is not enough for comfortable investing. Energy deliveries remain constrained, Europe has approved a rate increase, and China’s production is recovering faster than household purchases. Rising US wealth provides a counterweight, but it is not shared equally. This review covers the calendar days of 9–15 September; it is not a separate review of a completed trading week.
Period covered: 2026-09-09 – 2026-09-15Information as of 7 min read
China’s data on 15 September showed an uneven picture for August: industry strengthened, while consumption remained sluggish. On 14 September, the US ten-year Treasury yield was 4.97%, and French data were a reminder that more expensive debt does not mean buyers have disappeared.
Energy supply bottlenecks and the cost of borrowing remain the week’s shared question. The Federal Reserve decision is still ahead. A higher stock of wealth is not income distributed equally to everyone, and strong production alone does not prove strong consumption.
Week
What happened
9 September: the energy story depends on volumes and forecast dates
Unreliable energy supply continued to shape the backdrop at the start of the week. A company needs to know more than the price of oil: will the cargo arrive on time, and how much will delivery cost? Bigger fuel bills squeeze transport and industry, leaving households less money for other goods. A disruption announcement alone is not enough to calculate the volume of oil lost or the change in a particular company’s profits.
The outlook published by the US Energy Information Administration on 9 September added a longer-term perspective. Its model inputs, however, had been collected by 3 September. Events announced later therefore cannot be described as the reason for that forecast revision. Nor is a forecast average price for a future period today’s exchange price. For an investor, this distinction separates a possible scenario from a price move that has already happened.
10 September: Europe made a decision that takes effect later
The European Central Bank decided to raise all three key interest rates by 0.25 percentage points. The deposit facility rate will reach 2.50% on 16 September; at this review’s information cutoff, 2.25% still applies. This is the rate paid on banks’ overnight deposits at the central bank, not a household deposit or mortgage offer.
The decision matters because higher rates can help restrain price growth while making new investments harder to finance. Companies that must soon refinance debt need to assess the terms of their next loan. A variable-rate loan payment changes according to its specific contract and reset date, not automatically alongside the central bank. Higher rates can help banks’ income, but they do not erase the risk that some customers will find repayment harder.
11 September: US headline price growth accelerated, but not every measure worsened
US consumer prices rose 0.4% in August from the previous month after adjustment for normal seasonal patterns, compared with 0.1% in July. Annual inflation remained at 3.4%. At the same time, annual inflation excluding food and energy slowed from 2.5% to 2.4%. One release therefore offered both a warning about faster price growth in the latest month and a counterbalancing signal of slower core inflation.
What is the Consumer Price Index?
The Consumer Price Index summarises the prices of a basket of goods and services bought by households, using consumption weights. The monthly change shows the latest pace, while the annual change compares with the same month of the previous year. It is not each family’s personal change in spending. Removing food and energy helps track a more stable price trend, but does not mean households avoid these costs.
11 September: new wealth data explained another side of economic resilience
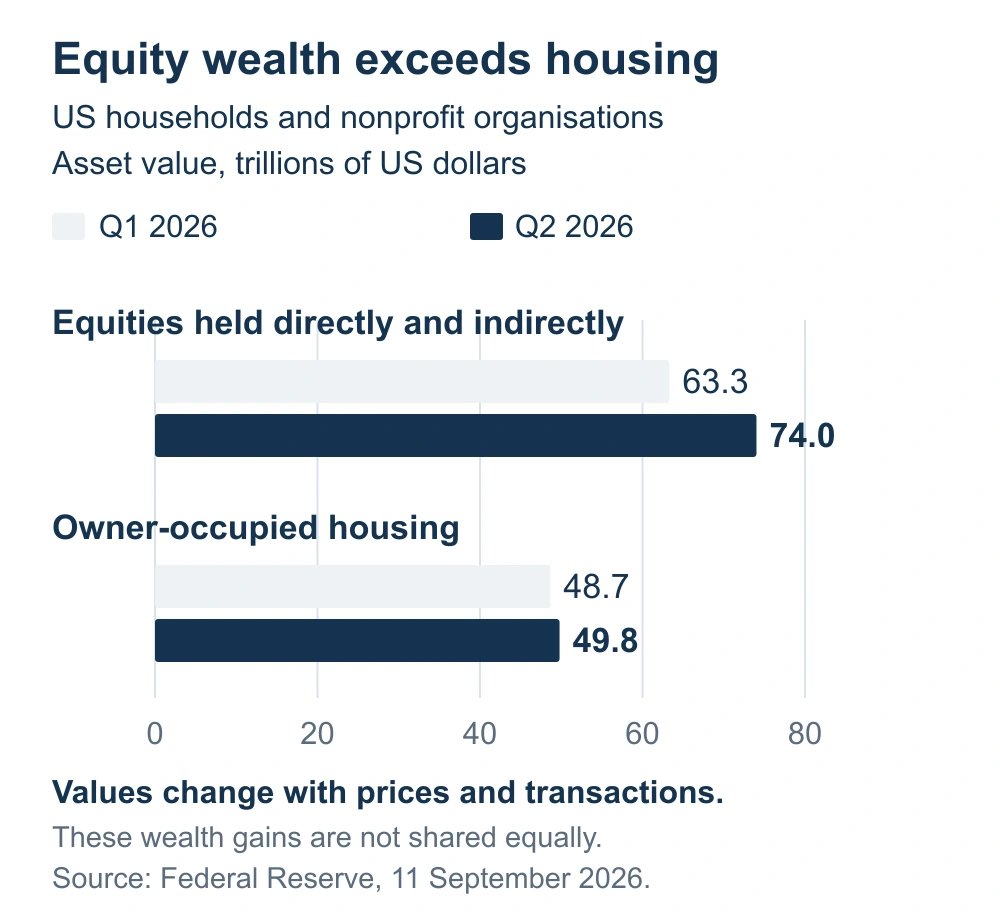
Federal Reserve statistics showed that the net worth of US households and nonprofit organisations reached 195.9 trillion US dollars in the second quarter, up about 7% from the previous quarter. Equities held directly and through funds and other vehicles were worth 74.0 trillion dollars, while owner-occupied housing was worth 49.8 trillion. These are end-June asset balances, not September trading results or cash in bank accounts.
11 September: supply problems remained larger than demand weakness
The International Energy Agency’s 11 September forecast projected a larger fall in oil supply than in demand this year. This is a forecast, not the final annual result.
Lower demand does not automatically mean cheaper oil. If the volume reaching buyers falls faster, fuel bills can remain high even as the economy slows. This can help an energy producer only if it can deliver its output. For a haulier or an energy-buying factory, the same situation raises costs.
14 September: more expensive government debt did not mean a shortage of buyers
France’s ten-year market yield indicator, published by its Treasury, stood at 4.48% on Monday, compared with 4.19% on 1 September. At the short-term Treasury bill auctions on the same day, 14 September, bids were 2.78–4.26 times the amount issued. These are instruments of different maturities: the auction does not prove equally strong demand for ten-year debt.
These facts help distinguish two situations. Borrowing can cost more even when there is no shortage of willing lenders. The price of new borrowing matters to the government budget, while fluctuations in market value matter to an existing holder of a longer-term bond. A higher yield is neither proof of insolvency nor a promise of risk-free returns.

Check your saving plan
Are your monthly contributions enough?
Compare your monthly contribution with your target future income. Adjust the time horizon to see how the amount you need changes.
This compares scenarios; it does not promise a future outcome.
Week
What matters now
15 September: China’s factories strengthened, but consumers were slow to spend
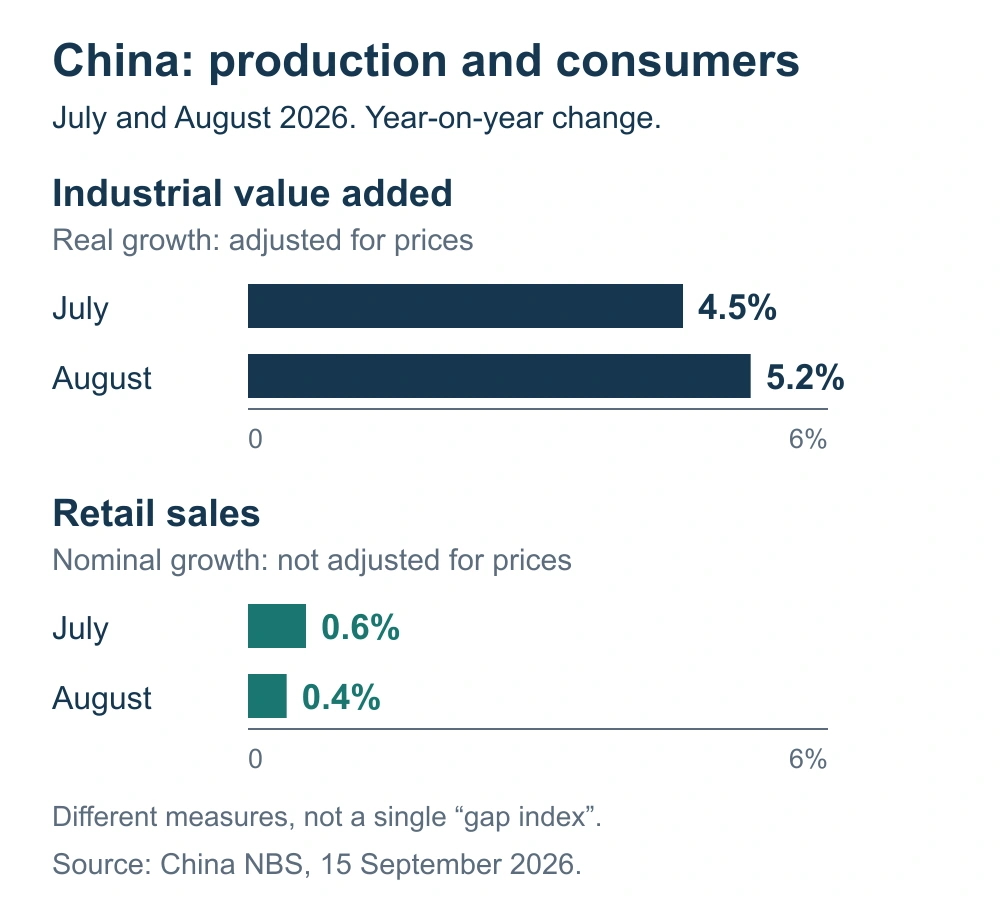
August year-on-year changes released on 15 September: China’s industrial output grew 5.2% in real terms, while retail sales increased 0.4% in nominal terms.
The unevenness itself matters to investors. An equipment or technology supplier can receive more orders while a business dependent on household spending experiences sluggish demand. China’s headline growth rate alone therefore cannot tell us how a European exporter or a commodity company will perform. We need to know who its customers are and what they use its products for.
? What are we actually comparing in China’s data?
Industrial value added measures the value created in production, and its real growth rate removes the effect of prices. Retail sales here measure the monetary value of sales at current prices. They do not cover all household spending, because many services fall outside this measure. Both percentages compare with August of the previous year, but their coverage and price adjustments differ.
14 September session: long-term financing is still expensive
US Treasury yields on Monday were 4.65% for two years, 4.97% for ten years and 5.34% for thirty years. Friday’s corresponding figures were 4.63%, 4.96% and 5.35%. The direction was not uniform over the session: shorter-maturity yields edged higher, while the longest maturity declined. These are nominal annual yields, not that day’s bond returns.
This small daily move does not remove the larger question: how much will it cost a company to borrow for the full life of an investment? The Federal Reserve decision has not yet been announced, and long-term bond prices reflect more than expectations for the next meeting. Inflation, debt supply and investors’ willingness to lend for a long time also matter. We therefore do not attribute the entire price movement to a single news item.
The influence of equities extends beyond the stock market
Wealth statistics offer another explanation for why demand need not weaken as quickly as an investor watching only borrowing rates might expect. Someone seeing a higher value for their investments may feel more confident about spending. That is a possible transmission channel, not a guarantee of every household’s behaviour. Equity ownership is unevenly distributed, and wealth gains include both revaluations and transactions.
Both sides matter to a portfolio. Resilient demand supports consumer-goods and services companies, but an equity correction could undermine some customers’ confidence. Higher selling prices help energy producers if they can deliver their output; the same prices raise costs for energy users. For a euro-based investor, the dollar exchange rate also changes the result from US assets. A higher US interest rate alone does not guarantee a stronger dollar.
Week
What comes next
16 September: a decision ahead, not an outcome already known
The two-day meeting of the Federal Reserve, the US central bank, begins today. Its interest rate decision will be announced on 16 September. Until then, the federal funds target range remains 3.50–3.75%, as left unchanged on 29 July. Also on 16 September, the already approved increase in Europe’s deposit facility rate to 2.50% takes effect. Today, that rate is still 2.25%.
The market assessment will depend on more than the number in the decision. What matters is whether higher energy costs spread to other prices, whether consumers can still increase their spending, and whether companies have more cash left after investing. More reliable supply and slower price growth would be more favourable for bonds and borrowers. The opposite combination would put greater pressure on companies paying their costs now while still waiting for revenue.
What would change the week’s conclusion?
A broader recovery in Chinese consumption would benefit not only factories but also retailers and services. In Europe, lower energy bills would leave more income for other spending. Until several indicators confirm that improvement, it helps investors to distinguish the seller from the buyer and the lender from the borrower. The same changes in interest rates and energy prices affect their results in different directions.
Important. This is general market analysis, not a personal recommendation to buy or sell. Historical data and company results do not guarantee future returns. Forecasts and conditional scenarios may not materialise.
How is the history preserved and updated?
All five periods in this edition share one information date. Week means the latest 7 days, quarter means 90 days, and year means the trailing 12 months. The next dated edition will have a separate URL. This text keeps its date and assessment; later events are not silently inserted into an older edition. Longer periods assess new evidence alongside earlier developments without repeating every headline.