
Weekly market review · 21–25 September
The economy is growing, but borrowing costs are rising
Companies are winning more orders, but higher interest and fuel costs could reduce the profits those orders generate. During the week of 21–25 September, a US–China trade initiative added another dimension: tensions are easing, but promises still need to become concrete rules.
The week at a glance
What moved markets before the detailed explanation
US stocks rose despite higher borrowing costs. Stronger business data and better US–China trade prospects face the pressure of interest and fuel costs.
- S&P 500 price index+1.21%18–25 September closes; in US dollars, excluding dividends and currency effects.
- Nasdaq Composite price index+2.06%18–25 September closes; in US dollars, excluding dividends and currency effects.
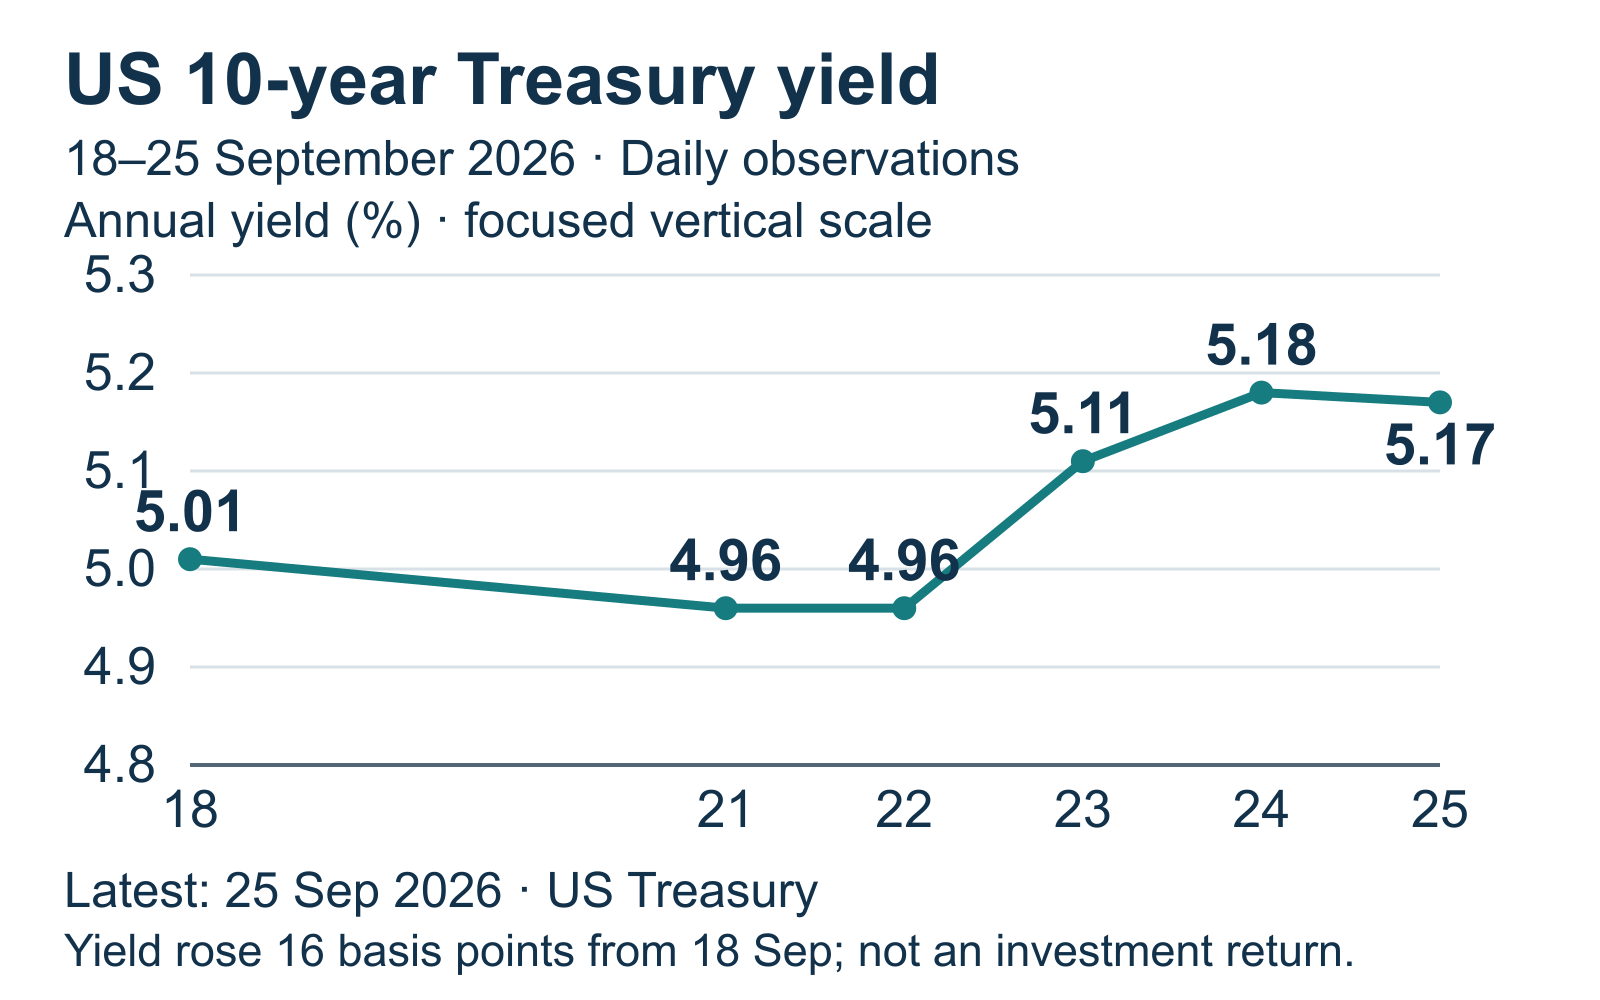
- US ten-year Treasury yield5.17%25 September; up 0.16 percentage points from 18 September. Not a weekly return.
- French ten-year government yield4.63%25 September TEC10; up 0.16 percentage points from 18 September.
- Euro against the US dollar−0.50%ECB reference rates, 18–25 September: from 1.1460 to 1.1403 USD per EUR.
A stronger economy does not necessarily mean an easier week for portfolios
US shares ended the week higher even as borrowing became more expensive. Between 18 and 25 September, the S&P 500 index of large US companies rose by 1.21%, while the technology-heavy Nasdaq Composite gained 2.06%. These are price changes in US dollars, excluding dividends and currency effects. They show that higher bond yields did not prevent shares from rising, but do not mean that every company is in equally good shape.
This week’s good economic news had another side. Stronger demand helps companies sell more, but can also sustain inflation and higher borrowing costs. For investors, knowing that business is expanding is therefore not enough. What matters is how much of the extra revenue remains after paying for loans, energy and employees’ work. That distinction helps explain why the same news can benefit some parts of a portfolio while creating risks for others.
The week did not follow a straight line. The US 10-year Treasury yield stood at 4.96% on both Monday and Tuesday. Stronger US and euro-area business survey results were released on Wednesday, 23 September; the long-term US yield rose to 5.11% that day. It climbed further on Thursday before ending Friday at 5.17%. The data and the bond-market move fit the theme of more expensive finance, but their timing alone does not prove that a single survey caused the entire move.
It relates the bond’s price to its contractual payments and maturity. A higher required yield usually lowers the price of an existing fixed-rate bond; it is not the return earned that week.
Friday’s data showed that businesses and consumers were in different positions. Total US durable goods orders were virtually unchanged in August, but the equipment orders segment grew. At the same time, September’s consumer survey showed weaker sentiment and higher expectations for inflation. Companies are still planning to invest, while shoppers are becoming more cautious about what they can afford. Actual spending data will have to show whether that concern translates into fewer purchases.
Trade policy offered a counterweight. Friday brought an announcement that the US and China had agreed recommendations for more favourable tariffs on some goods. This offers the prospect of lower costs for importers, not proof that trade disputes are over. Energy supplies also depend on actual deliveries, not just diplomatic statements. For now, therefore, a better trade outlook does not remove the risks of higher interest rates and fuel prices.
For portfolios, this means separating distinct sources of risk. Industrial equipment suppliers depend on demand; indebted companies face refinancing costs; long-dated bonds respond to changes in yields. The euro weakened against the dollar by about 0.50% over the week, based on the European Central Bank’s reference rate, so the currency move supported the euro value of unhedged dollar investments. In energy, crude oil stocks and supplies of finished fuels continued to tell different stories. The next tests are actual consumer prices and spending, the labour market, and companies’ ability to turn orders into cash.
The US 10-year yield reached 5.17% as growth signals strengthened
Higher yields offer new bond buyers a more attractive starting point for income, but can put pressure on the prices of bonds already held. Between 18 and 25 September, the US 10-year Treasury yield rose from 5.01% to 5.17%. The increase at the shorter, two-year maturity was smaller: from 4.76% to 4.81%. These are market yields, not a new central-bank interest-rate decision or the return earned on bonds during the week.
? Bond yield: what does it tell us?
A yield relates a bond’s price to its contractual payments and maturity. When the yield investors require rises, the price of an existing fixed-rate bond generally falls; 5.17% is neither a return earned in one week nor a promise from a bond fund.
Economic weakness offered little obvious relief this week. The preliminary US composite Purchasing Managers’ Index (PMI) for September, released on Wednesday, rose to 58.4 from 56.0 in August. That supports the outlook for company sales, but the survey also pointed to faster cost increases. Growing demand may make it easier to raise prices, yet not every business can pass its entire additional bill on to customers.
? Purchasing Managers’ Index: how should we read 58.4?
The survey combines businesses’ responses about changes in activity from the previous month. A reading above 50 generally indicates expansion and one below 50 contraction; 58.4 is not a percentage growth rate for the economy, and a preliminary reading may still be revised.
Higher borrowing costs are particularly important for artificial intelligence infrastructure. On 24 September, cloud services company Akamai announced a US$11.6 billion commitment over seven years from artificial intelligence developer Anthropic. The agreement was signed on 18 September; payments depend on service delivery and other contractual conditions. It underpins future demand, rather than representing revenue already received or profit already earned.
Growth will also require substantial spending. Akamai estimates the related capital investment at about US$5.5 billion and is raising its capital expenditure forecast for 2026 alone by about US$1.7 billion, while leaving its revenue forecast for that year unchanged. Subtracting those sums does not produce a profit figure: they cover different periods and do not include all operating costs. This is an opportunity for equipment suppliers, but a financing and delivery risk for infrastructure owners. That makes the launch of services, actual investment spending and cash flow more important to watch than the size of the contract alone.
Long-dated bond funds and companies whose expected profits lie mostly in the distant future tend to be more sensitive to higher yields. Strong demand can help equipment manufacturers, while new loans may become more expensive for heavily indebted property companies. The opportunity is to distinguish carefully between better prospective interest income and the risk of price swings. The next test comes with US August price and spending data on 30 September: is the strength being driven by people buying more, or mainly by higher prices?
For your investments
Let’s discuss your portfolio
 FINANCIAL FREEDOM01 / 04
Investment results since 1999
Are you beating
global equities?

at the end of the period
Jan 1999–Jun 2026 · EUR · Cumulative return, %
Linear scale · * MSCI World → MSCI ACWI.
Past performance does not guarantee future returns.
FINANCIAL FREEDOM02 / 04Historical comparison
How far did it fall?
How long to recover?
Decline from the previous high

Longest recovery to the previous high

Jan 1999–Jun 2026 · EUR · Monthly data
* MSCI World → MSCI ACWI.
Past performance does not guarantee future returns.
FINANCIAL FREEDOM03 / 04Personal investment consultation
Already investing?
Let’s review your portfolio.
Yet to start
investing?
Let’s build your first
investment plan.
FINANCIAL FREEDOM04 / 04
Personal investment
consultation
Martynas
Juška
Investment manager
Managing a portfolio
of more than€100 million
Businesses are investing, but there is still a long way from orders to profits
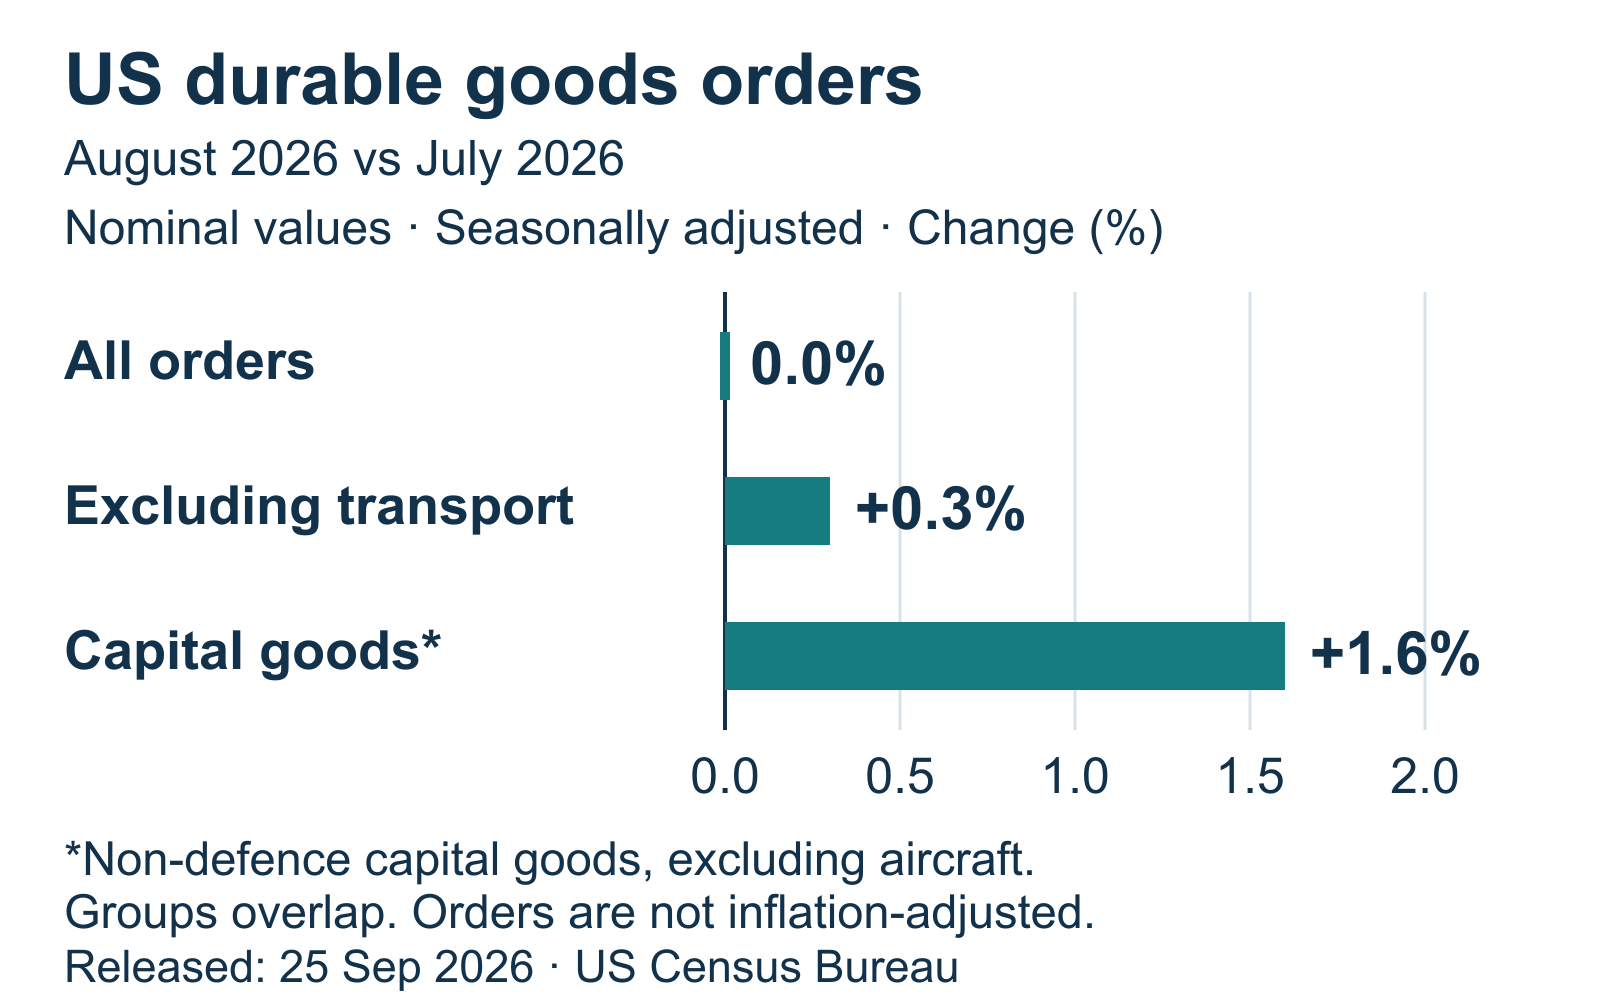
Friday’s US orders headline looked quiet, but its composition told investors more. New durable goods orders totalled US$338.6 billion in August, virtually unchanged from July. However, orders for non-defence capital goods excluding aircraft rose by 1.6%. This segment helps gauge demand for business equipment, rather than all investment or artificial intelligence spending alone.
? Capital goods orders: what does this measure leave out?
Capital goods are equipment and other assets used in production; excluding defence and aircraft orders reduces the influence of large individual contracts. The figures are seasonally adjusted but not adjusted for prices, an order is not yet a delivery or profit, and new orders data exclude semiconductor manufacturing.
Households, meanwhile, felt less confident. The University of Michigan’s final September consumer sentiment index fell to 48.1 from 51.7 in August. One-year inflation expectations rose from 4.0% to 4.6%. These are people’s responses about expected prices, not inflation that has already been measured. Sentiment can influence purchasing decisions, but the survey alone does not establish that retailers’ sales have already fallen.
Higher orders offer an opportunity for industrial equipment and automation suppliers. For sellers of discretionary goods and providers of consumer credit, the more important question is whether customers can afford to pay. The main risk on either side is assuming that an order book or a survey reading will automatically translate into a particular change in profit. Upcoming consumer spending data and companies’ results presentations will help show how much demand remains after the effects of prices and financing costs.

Professional portfolio management
Markets change every week. Your portfolio should not change with every headline.
Portfolio management turns market information into a consistent process: risk and concentration are monitored, while decisions follow your agreed strategy instead of the latest market move.
Business activity is strengthening in Europe, but debt is becoming more expensive too
The euro area’s September business signal improved, so it cannot be dismissed as a market weakening on every front. The preliminary composite Purchasing Managers’ Index, released on 23 September, rose to 53.1 from August’s final reading of 52.0. That indicates faster expansion in the activity captured by the survey, not a corresponding rate of growth in gross domestic product. Businesses also reported faster increases in both costs and selling prices.
More expensive finance is not just a US story. The French Treasury’s 10-year bond yield indicator rose from 4.47% to 4.63% between 18 and 25 September, an increase of 0.16 percentage points. That is not enough to attribute the entire rise to French politics, but it shows that investors were demanding a higher return to lend to the government. Companies’ borrowing costs also depend on their own risks, so the government bond yield is not the interest rate every business pays.
One better month is not enough to ensure a strong year. On 23 September, the Organisation for Economic Co-operation and Development forecast real euro-area growth of 1.0% in both 2026 and 2027. It also warned about investment in artificial intelligence becoming more reliant on external finance: if the expected returns do not materialise, both shareholders and lenders could suffer losses. This is a risk scenario, not a downturn that has already happened.
Improving activity may help European industrial companies make better use of existing capacity. For businesses with substantial debt or large energy bills, however, higher costs may offset the improvement in revenues. Currency also matters to a euro-based investor: between 18 and 25 September, the ECB reference rate moved from US$1.1460 to US$1.1403 per euro. If an asset’s dollar value is unchanged and the currency exposure is unhedged, that strengthening of the dollar increases its euro value by about 0.50%. This illustrates the currency effect, not the weekly return on US equities.
The opportunity lies in businesses where underlying demand is improving faster than costs are rising. The risk is treating one better survey as a turning point for profits across Europe, or overlooking currency hedging. The next final business survey results and company profit margins will help distinguish a more durable improvement from a one-month respite.
The US–China trade initiative offers hope, but is not yet lowering bills
The trade announcement offered a counterweight to concerns about higher costs. On 25 September, the White House announced agreed recommendations for more favourable tariffs on US$30 billion of non-sensitive goods in each direction. That is the intended value of goods covered, not an equivalent saving in tariffs. The document still identified difficulties in supplies of rare earths and other critical minerals as a problem being addressed.
Lower tariffs, if implemented, would reduce the cost of some imported goods. US consumer goods retailers could retain more of the savings or offer customers lower prices. For agricultural exporters, the more important opportunity is easier access to buyers. But tariff relief may not be enough for car and electronics manufacturers if materials needed for production remain in short supply.
The value of this announcement will depend on implementation. The published recommendations are not yet lower-tariff rules that apply to everyone. The next things to watch are specific product lists, tariff rates, effective dates and actual deliveries. Until those are available, the prospect of a trade agreement may improve expectations, but cannot yet be counted as profit companies have earned.
More crude oil does not necessarily mean plentiful fuel stocks
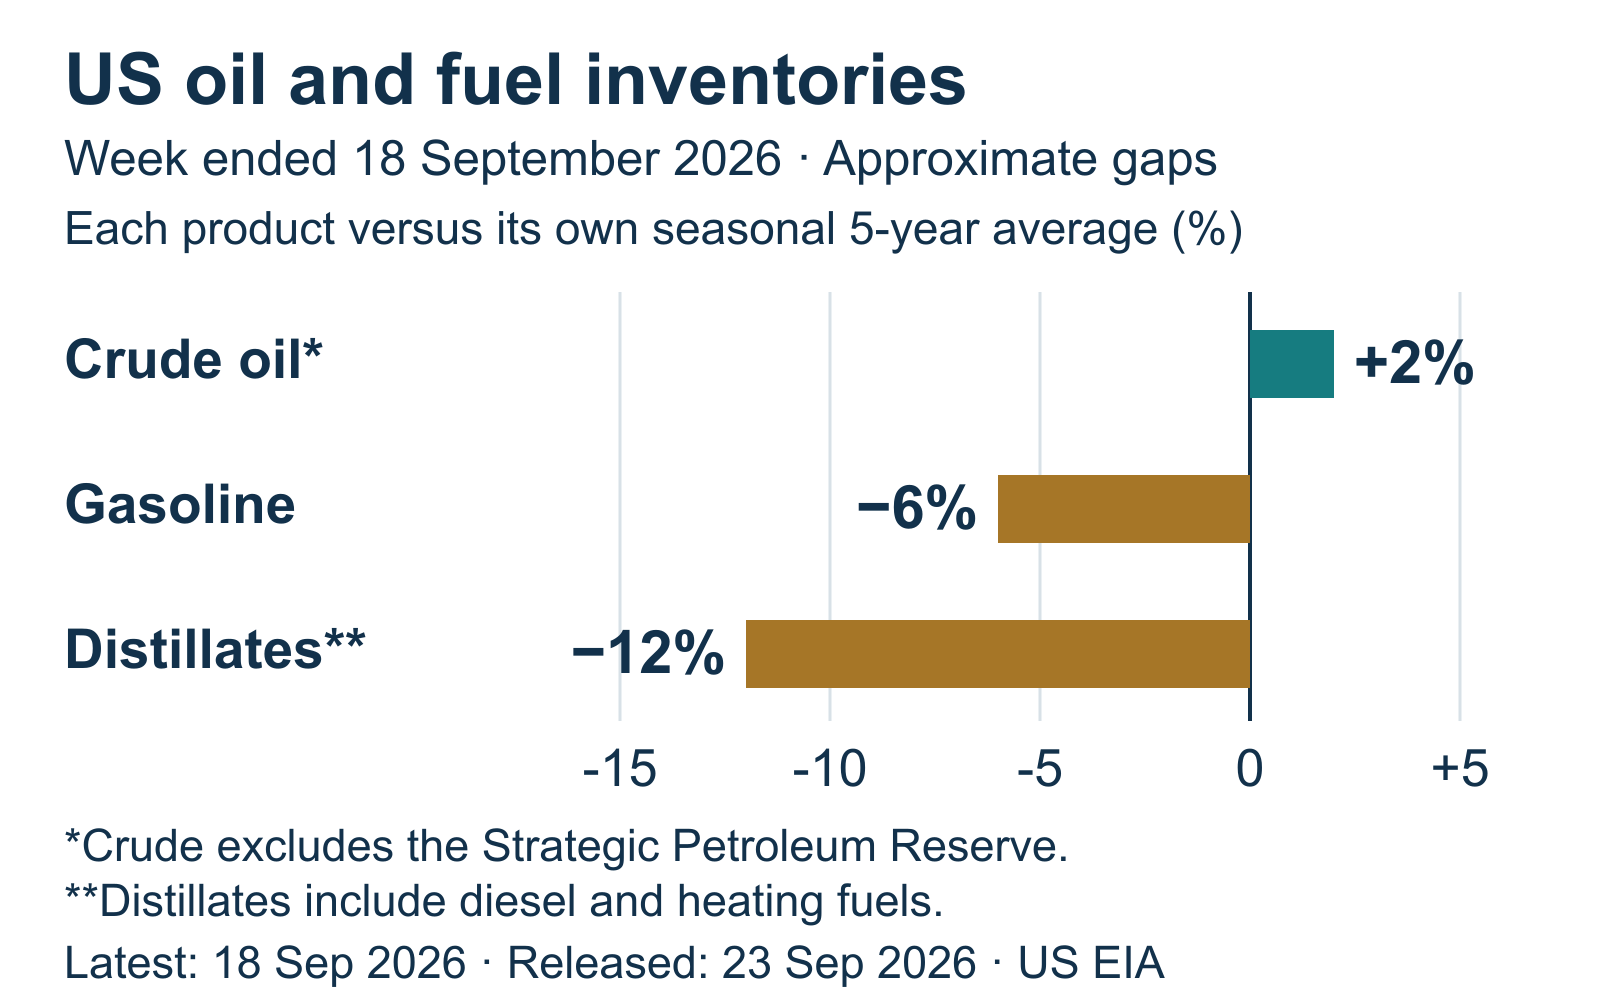
Energy risks need to be assessed product by product. In the US Energy Information Administration’s report released on 23 September, commercial crude oil stocks were about 2% above their seasonal five-year average. Yet petrol stocks were about 6% below their own average, and distillate stocks about 12% below theirs. The figures cover the week ending 18 September; they are the latest weekly data available by this review’s cut-off, not a measurement of stocks on Friday.
? Distillates and seasonal averages: what are we comparing?
Distillates include diesel and heating oil, so the total does not measure diesel stocks alone. Each product group is compared with its own average for the same time of year over the previous five years; a 12% shortfall is not a weekly fall in stocks.
Diplomacy cannot close that gap overnight. The US announcement on 25 September said that the president had urged China to increase production of petroleum products, but gave no agreed volume of additional supply. What matters to the market is when the fuel actually reaches buyers. More crude oil or a political appeal alone does not guarantee a lower bill for a haulier.
Tight product supplies may benefit refiners, but their profits also depend on crude, energy and maintenance costs. More expensive fuel squeezes transport and logistics companies’ profits if they cannot adjust customer charges quickly. Energy investments can therefore be very different: they may involve producing the raw material, refining it or using the finished product.
The opportunity for investors is to distinguish between oil producers, refiners and fuel users, rather than treating the entire chain alike. The risk is assuming that a gap in stocks makes price rises inevitable: demand, imports and production can all change. The 30 September report will be important for assessing whether petrol and distillate stocks are recovering together. More crude oil alone will not answer that question.
Watch not just growth, but how much of it reaches the investor
The week did not support the simple conclusion that a strong economy benefits every investment equally. Business activity and equipment orders support the potential for revenues, while higher long-term yields and uneven energy stocks create cost risks. Weaker consumer sentiment is a warning, but not yet evidence of an actual decline in consumption. Portfolio resilience depends on the differences: bond maturities, company debt, the ability to protect profits, and the share of currency exposure left unhedged.
Three signals will test the picture in the coming week. US August spending and price data on 30 September will show whether people are buying more and how much of their spending reflects higher prices. The fuel stocks report on the same day will help assess supply pressures. On 2 October, the US September labour market report will show whether employment and labour income are supporting the economy’s resilience. These releases are still ahead; this review does not predict their results.
Important information. This is general market analysis, not a personal investment recommendation. Investment values and income can fall; past performance and forecasts do not guarantee future returns.