
Year · Market review
Over the year, rate cuts gave way to renewed increases
Japan’s equity decline on 20 November closes this review’s sequence of observations, not the US trading day. Over twelve months, late-year rate cuts gave way to renewed increases; trade rules and energy supplies changed business costs; technology expansion increased both sales and financing needs. These forces interact: rapid growth in a sector does not guarantee equal profits for every participant. Information cutoff: 20 November 2026, 10:00 Lithuanian time.
Period covered: 2025-11-21 – 2026-11-20Information as of 13 min read
A further equity sell-off coincided with declining US Treasury yields. The latest manufacturing and Japanese price figures cannot all be explained by a single inflation or growth scenario.
US interest rates remain above their level after the December 2025 cut. Future technology demand and announced trade plans are not profits already earned by every company.
Year
What happened
Interest rates did not fall everywhere at the end of 2025
At the start of the period beginning on 21 November 2025, the Federal Reserve’s target range was 3.75–4.00% and the European Central Bank’s deposit rate was 2.00%. On 10 December, the US central bank lowered its range to 3.50–3.75%. On 18 December, the Bank of England announced a cut from 4.00% to 3.75%. This was a more favourable direction for borrowers, but not a promise that every subsequent decision would be the same.
Japan moved the other way. On 19 December, its central bank announced an increase from 0.50% to 0.75%, effective on 22 December. A company borrowing in yen and one with a dollar loan therefore did not face identical conditions. Different interest rates also affect currencies’ appeal, although exchange rates depend on trade, investor expectations and willingness to take risk as well.
Before this period began, the US–China agreement announced on 1 November provided for a 10-percentage-point reduction in the US fentanyl-related tariff, effective on 10 November. That earlier event explains the initial trade backdrop but falls outside the twelve months now under review. Nor did a reduction in one duty mean a uniform final tariff on every Chinese product.
In spring, an energy-supply shock followed changing trade rules
On 20 February, the US Supreme Court ruled that the International Emergency Economic Powers Act did not authorise presidential tariffs. Duties based on other laws did not disappear. That day, the administration used another legal basis to announce a temporary 10% import surcharge with exemptions, scheduled from 24 February to 24 July. Exporters needed the rule applying to their particular product and its validity dates.
The Middle East war beginning on 28 February disrupted oil shipments through the Strait of Hormuz. On 11 March, International Energy Agency countries agreed to make 400 million barrels of emergency stocks available to the market. This was a commitment to be implemented over time, not the entire delivery of oil on one day. Stocks can temporarily replace missing supply, but releasing them does not itself reopen shipping routes.
An interim US–Iran ceasefire in June helped some shipping restart. The agency’s 10 July report put Gulf oil exports in June, including routes bypassing the Strait, at 16.1 million barrels a day, compared with 24 million before the war. Renewed hostilities on 7–8 July again threatened supply. A political announcement alone was therefore insufficient to secure a lasting reduction in fuel expenses.
Europe was also changing its energy-supply arrangements over a longer horizon. On 26 January, the Council of the European Union approved a gradual phase-out of Russian gas imports: a full liquefied-natural-gas ban from early 2027 and a pipeline-gas ban from autumn, with transition periods. Further sanctions targeting Russian finance, oil and vessels were adopted on 23 July. Supply contracts and permitted routes became as important as the commodity price itself.
Central banks resumed rate increases during summer and autumn
On 11 June, the European Central Bank decided to raise its deposit rate to 2.25% from 17 June. On 10 September, it announced another increase to 2.50%, effective on 16 September. The Federal Reserve restored its range to 3.75–4.00% on 16 September. Renewed tightening thus followed the previous year-end cuts, increasing the cost of loans that needed new financing.
On 16 June, the Bank of Japan announced an increase to 1.00% from 17 June, followed on 18 September by an increase to 1.25% from 24 September. Australia started earlier: its rate rose to 3.85% on 3 February, 4.10% on 17 March, 4.35% on 5 May and 4.60% on 29 September. Each step was 0.25 percentage point.
The US, euro-area and Japanese central banks retained their latest levels on 28, 29 and 30 October respectively. Canada increased its rate from 2.25% to 2.50% on 28 October. Australia raised its rate to 4.85% on 3 November, and the United Kingdom to 4.00% on 5 November. Countries were not moving through one general rate-cutting phase.
The US consumer-price report released on 10 November showed why broad relief remained elusive. October prices rose 0.4% over the month after September’s 0.6%, but prices excluding food and energy increased 0.3% for a third consecutive month. A monthly slowdown in the headline measure did not mean uniformly easing price pressures across all goods and services.
A trade opportunity differs from a promise not yet implemented
Provisional application of the European Union’s trade agreement with Argentina, Brazil, Paraguay and Uruguay began on 1 May. Initial tariff relief covered cars, medicines and some food and beverages. Application had begun, although the whole partnership had not been finally ratified. European sellers gained an opportunity to compete at a lower final price, but actual revenue still required orders.
On 23 July, the US Trade Representative announced new tariffs on 60 economies, including the European Union and China, concerning enforcement of bans on goods produced with forced labour. The measure effective from 24 July set rates of 10% or 12.5%, with exemptions. For certain EU and other partners’ goods, the additional duty was reduced by the ordinary customs duty already applicable. This was a different measure, not a simple extension of February’s temporary surcharge. A company’s expenses depended on which rule covered its supplies.
On 25–27 September, the US and China presented product groups recommended for tariff relief with a 2024 trade value of roughly US$30 billion in each direction. The US side included agricultural goods and medical equipment, and the Chinese side household appliances and toys. A recommendation still needed to become a concession applying to a particular product. The direction of negotiations alone could not be entered into an earnings forecast as costs already saved.
Equipment suppliers grew, but customers needed more financing
On 26 August, US chip designer NVIDIA reported year-on-year revenue growth of 106% and operating-profit growth of 124% for its quarter ending on 26 July. On 15 October, Taiwanese chip manufacturer TSMC reported third-quarter revenue of US$46.72 billion and fourth-quarter revenue guidance of US$52.3–54.3 billion. Chip demand was already becoming suppliers’ sales, but the projected following quarter was not revenue already earned.
For your investments
Let’s discuss your portfolio
 FINANCIAL FREEDOM01 / 04
Investment results since 1999
Are you beating
global equities?

at the end of the period
Jan 1999–Jun 2026 · EUR · Cumulative return, %
Linear scale · * MSCI World → MSCI ACWI.
Past performance does not guarantee future returns.
FINANCIAL FREEDOM02 / 04Historical comparison
How far did it fall?
How long to recover?
Decline from the previous high

Longest recovery to the previous high

Jan 1999–Jun 2026 · EUR · Monthly data
* MSCI World → MSCI ACWI.
Past performance does not guarantee future returns.
FINANCIAL FREEDOM03 / 04Personal investment consultation
Already investing?
Let’s review your portfolio.
Yet to start
investing?
Let’s build your first
investment plan.
FINANCIAL FREEDOM04 / 04
Personal investment
consultation
Martynas
Juška
Investment manager
Managing a portfolio
of more than€100 million
On 12 November, German industrial-technology company Siemens reported Smart Infrastructure orders of €8.665 billion and revenue of €7.239 billion for July–September. The division’s profit reached €1.468 billion, with US tariff refunds providing an additional benefit. This shows that an electrical-equipment seller can earn money during construction, but the tariff-refund benefit should not automatically be treated as a recurring part of profitability.
On the other side of the chain, US data-centre services provider CoreWeave reported third-quarter operating income of US$207 million and net interest expense of US$846 million on 10 November. Operating income was insufficient to cover interest. Company revenue is not the profit left for shareholders: operations, financing and other obligations also have to be paid.
On 16 November, Federal Reserve governor Michael Barr broadened the discussion to financing at major artificial-intelligence companies. He cited a forecast that the seven largest companies’ balance-sheet debt would exceed US$800 billion by year-end. Separately, he discussed more than US$3 trillion of potential maximum gross nominal off-balance-sheet commitments, covering contracts, leases and guarantees. These different amounts are not one sum of current debt.
More than US$100 billion of cumulative investment from major cloud and chip suppliers went to model laboratories and cloud start-ups, which spend some of the money on their investors’ services. Barr warned of reduced spending and forced-asset-sale risks, while capital and still-limited leverage counterbalance the danger of direct bank credit losses. Ultimately, independent paying customers’ revenue must support expansion, not merely new funding arrangements between the same companies.
At 23:20 Lithuanian time on 17 November, after the US market close, US chip designer NVIDIA reported revenue of US$115.8 billion for the quarter ended 25 October, 103% more than a year earlier. This is new confirmation that technology-infrastructure expansion is turning into supplier sales; the return on its customers’ investment remains a separate question.
The latest figures show uneven growth, not one global direction
Improved energy supply did not yet mean cheap purchases. The US Energy Information Administration estimated on 10 November that Middle Eastern oil production shut-ins averaged 2.5 million barrels a day in October, compared with the May peak of 10.9 million. Brent still averaged US$124 a barrel in October, against US$114 in September. A monthly average is not this morning’s oil price.
Eurostat reported on 13 November that the euro area’s September energy trade deficit increased from €20.7 billion to €33.0 billion over a year. Total goods exports grew 6.0% and imports 16.1%. The overall €10.3 billion deficit arose not because exports necessarily fell, but because the monetary value of imports increased faster.
On 16 November, China reported October value-added growth at industrial enterprises above the official size threshold of 4.8% from a year earlier and consumer-goods retail-sales growth of only 0.4%. Industry is measured at constant prices and retail sales in monetary values, so subtracting the percentages would not produce a common indicator. They nevertheless help distinguish producers’ activity from final consumers’ spending.
Japan’s first third-quarter estimate, released that same day, showed almost no change in real economic output from the second quarter. Private consumption fell 0.3% and private non-residential investment rose 1.6%. Companies can build and buy equipment while households spend less. In that situation, future use of capacity matters, not construction’s scale alone.
The 18 November minutes explained why a rate pause is not a promise to cut
The Federal Reserve published minutes of its 27–28 October meeting. It had retained the 3.75–4.00% target range by ten votes to two; both dissenters wanted an increase. Almost all participants regarded a further increase as likely to be needed in their baseline scenario. This was an earlier discussion, not a new November decision: the December choice will also depend on subsequent data.
On 19 November, weaker orders coincided with higher costs
The Philadelphia manufacturing survey index declined from October’s 20.9 to 6.3 points in November. New orders fell from 4.3 to −0.4, while prices paid rose from 43.2 to 58.2. Responses were collected on 9–16 November. This is an uncomfortable combination for a manufacturer unable to pass more expensive inputs on through its selling prices.
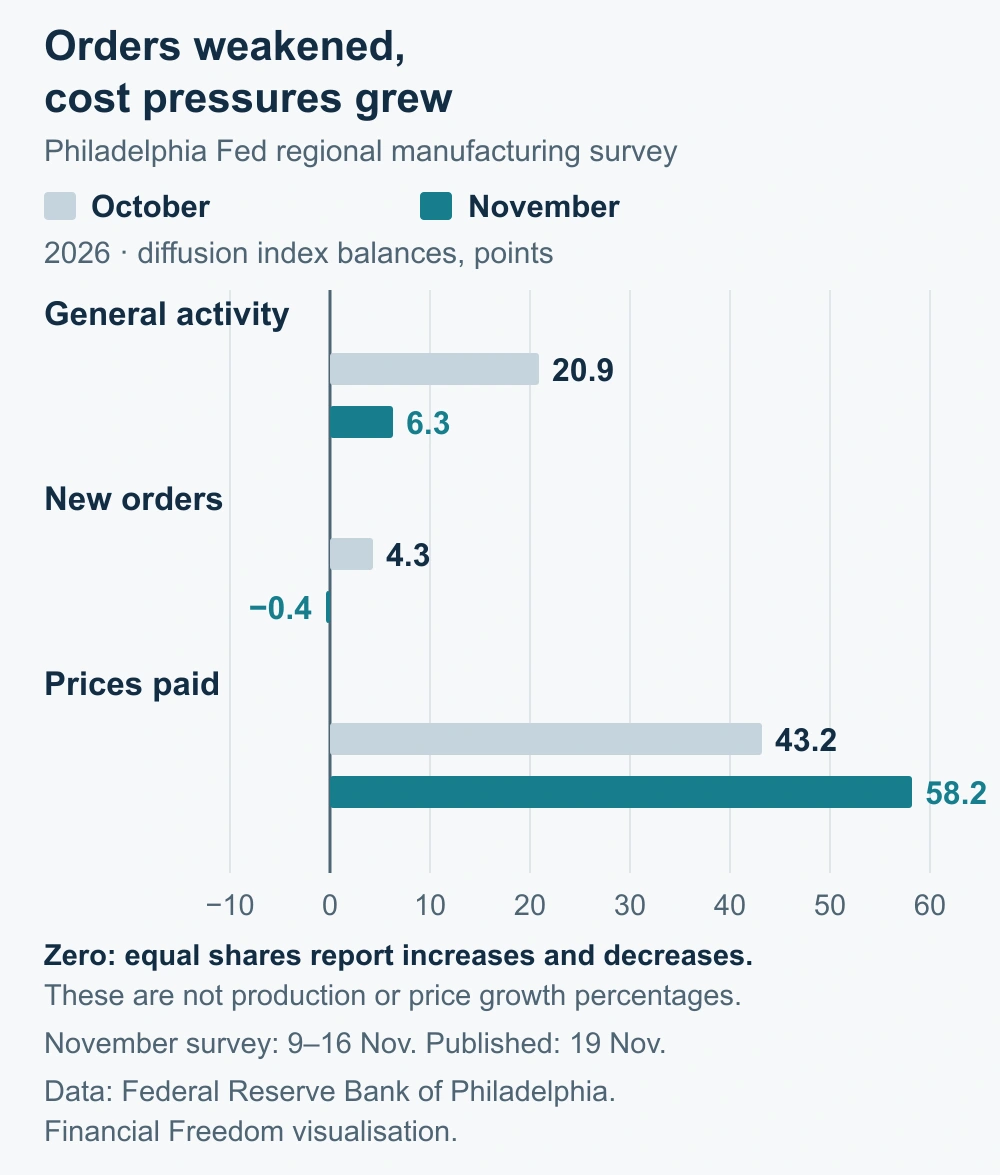
Shipment and employment indices remained positive at the same time. The survey therefore cannot be read as an established decline in manufacturing across the US. It identifies a more specific risk: weaker new orders and less scope to protect profits if costs continue to rise.
On 20 November, Japanese shares fell while inflation measures diverged
Following a 2.25% decline in the US Nasdaq Composite on 19 November, Japan’s Nikkei 225 closed 5.06% below its previous session on 20 November. These are separate-session price-index changes in dollars and yen, excluding dividends, not a euro portfolio return over this review period. Friday’s US trading had not begun by the information cutoff.
That morning, Japan released October consumer-price figures. Annual headline growth accelerated from September’s 2.1% to 2.3%, but slowed from 2.4% to 2.2% excluding fresh food and energy. Price pressure was therefore not increasing uniformly. This release is not a new Bank of Japan rate decision, and its timing alone does not establish that it caused the entire equity decline.
Year
What matters now
Bond prices and corporate profits do not depend on exactly the same things
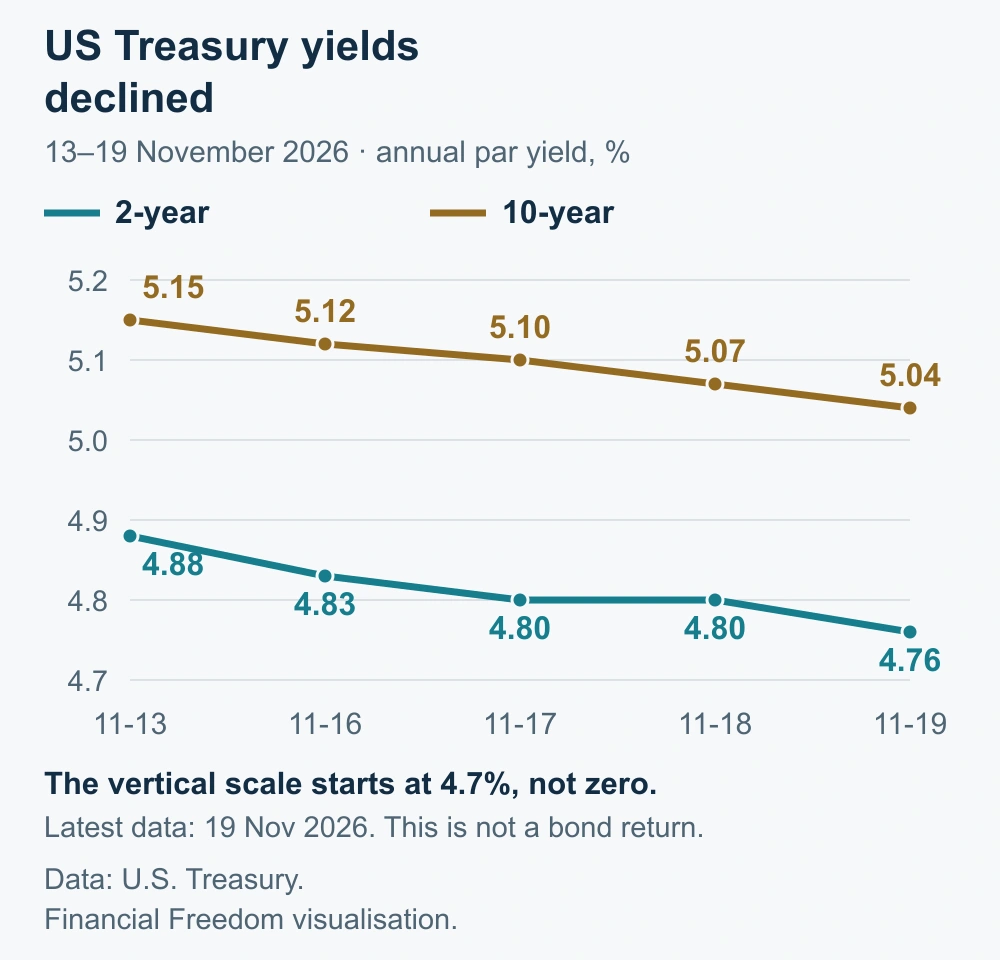
US Treasury yields continued to decline on 19 November: the two-year yield was 4.76% and the ten-year yield was 5.04%. Their respective levels on 13 November were 4.88% and 5.15%. Lower market yields generally support previously issued fixed-rate bonds, but a technology share still needs sufficient future earnings.
Portfolio risk depends on revenue sources, not just company counts
Chip, electrical-equipment and cloud-company shares look different, but their orders can depend on the same data-centre expansion. Adding bonds funding such projects does not necessarily reduce that dependence. Shareholders first feel the cost of lower expected profits; creditors face the risk that payments run short of cash. A different security label does not yet mean a different economic source of revenue.
An opportunity emerges if technology genuinely saves customers working time or helps them sell more, turning those benefits into demand for paid services. New equipment can then be used for more than trials. Risk arises if many projects rely on the same overly optimistic order assumptions. Long-term investors need to consider not only revenue growth but also cash remaining after operating and investment expenses, debt maturities and equipment becoming obsolete.
High-quality government bonds would benefit from easing inflation without a new supply shock. A weaker company’s debt can behave differently because lenders also assess its ability to pay on time. Lower energy costs would help European industrial shares, while a lower selling price would remove part of the benefit for oil producers. The reason prices fall therefore matters: better supply or disappearing orders.
European banks’ capital provides an important counterweight to financing concerns. On 19 November, the ECB announced total capital requirements and guidance of 15.7% of risk-weighted assets for 2027, while the actual ratio using the same capital definition stood at 20.1% in the second quarter of 2026. This buffer can help absorb losses, but does not protect bank shares against falling prices or future bad loans.
For a euro investor, currency remains a separate question. US equity and bond returns in dollars can differ from returns in euros, while currency hedging has its own costs. A fund’s currency, underlying holdings and hedging arrangements therefore need to be considered together.
Year
What comes next
20 November US trading: will the selling continue?
The US session had not begun by the information cutoff. It will show whether US shares remain under pressure after Japan’s decline and whether falling Treasury yields continue to provide a counterweight. A single Friday will not establish a lasting reversal.
25 November US economic estimate: how strong is demand?
The US Bureau of Economic Analysis will publish its second estimate of third-quarter gross domestic product. The key question is whether revisions change the assessment of consumption and investment: spending by final customers will help determine the use of capacity being built today.
The 8–9 December Fed meeting and 17 December manufacturing survey
The US central bank will decide whether to change its target range. The following Philadelphia survey will test whether weaker orders and rising costs have persisted. Stronger demand without another jump in costs would provide a clearer earnings outlook than a share-price rebound alone.
Early 2027: implementing decisions already announced
Under its 30 October decision, the Bank of Japan plans to increase disposals of its exchange-traded fund holdings from January 2027, from approximately 330 billion to 860 billion yen a year at book value. This is a planned future pace, not an amount already sold in November. Book value can differ from the market sale price. From 1 January 2027, the Russian liquefied natural gas import ban will also cover the remaining long-term contracts. In both cases, actual transactions, transition conditions and buyers’ adjustments matter, not the announced direction alone.
Important. This is general market analysis, not a personal recommendation to buy or sell. Historical data and company results do not guarantee future returns. Forecasts and conditional scenarios may not materialise.
How is the history preserved and updated?
All five periods in this edition share one information date. Week means the latest 7 days, quarter means 90 days, and year means the trailing 12 months. The next dated edition will have a separate URL. This text keeps its date and assessment; later events are not silently inserted into an older edition. Longer periods assess new evidence alongside earlier developments without repeating every headline.