
Week · Market review
Seven days: the equity sell-off ran ahead of economic weakness
The US sell-off on 5 November, Japan’s decline on 6 November and the partial recovery on 9 November showed how quickly the price paid for future earnings can change. Yet US employment and productivity releases did not show an equally abrupt economic deterioration. For portfolios, a lower share price and a weaker capacity to earn profits are different developments.
Period covered: 2026-11-03 – 2026-11-09Information as of 6 min read
During 3–9 November, Australia and the United Kingdom raised interest rates, the US revised earlier payroll increases upwards, and China published a new divergence between consumer and producer prices on Monday.
Energy costs remain unevenly distributed across industries. The US target interest-rate range has remained at 3.75–4.00% since 28 October, while political statements about future regulation are not enacted decisions.
Week
What happened
The US election raised new questions about business costs
The US held congressional elections on 3 November. On 4 November, Democratic Senator Sheldon Whitehouse announced in an official statement that his party had won control of both chambers. This was a politician’s statement, not a final list of seats certified by every state. For investors, the next distinction matters: an election result does not itself change tariffs or the taxes that companies pay.
On 5 November, Senate Democratic leader Chuck Schumer discussed stopping tariffs and protecting households from electricity-infrastructure costs shifted onto them because of concessions to data centres. These were intentions for a future legislative agenda. A potential redistribution of costs matters to data-centre owners, electricity-network companies and their customers, but the speech established neither a specific amount nor an effective date.
Japanese shares fell after the US sell-off
On 5 November, the US S&P 500 price index fell 4.36% and the Nasdaq Composite declined 5.52%. The broader index’s fall shows that selling was not confined to one technology company. Political uncertainty provides important context, but one statement does not establish the reason for every trade that day. Earnings expectations, interest rates and investors’ willingness to accept risk can all affect prices.
On 6 November, Japan’s Nikkei 225 fell 5.96%, with 222 of its 225 constituents declining. The US Nasdaq rose 1.09% that day, while at 07:50 Lithuanian time on 9 November the Japanese index stood 2.41% above Friday’s close. Monday’s session was still under way. The partial recovery reduced the latest loss but did not restore markets to their preceding position.
? Session and period changes: what is being compared?
These are individual session price changes from the previous close, not the return for the whole 3–9 November period. They exclude reinvested dividends and currency effects for a euro investor; Monday’s observation was not final.
US employment and productivity countered fears of a downturn
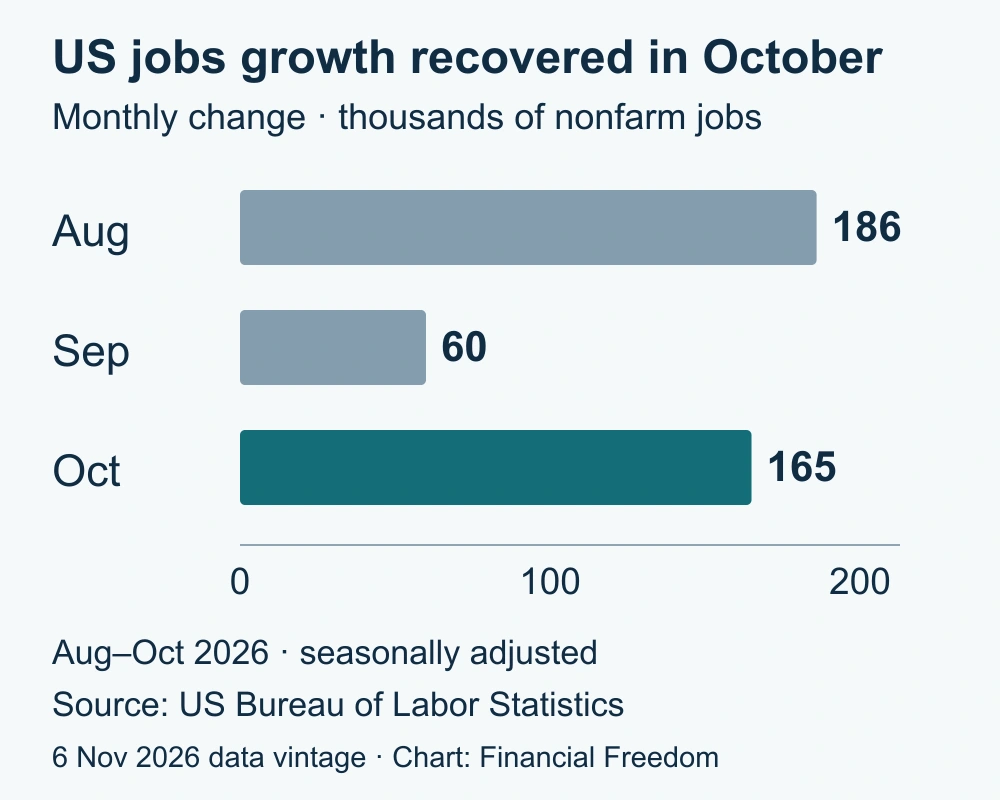
On 6 November, the US reported an increase of 165,000 non-farm payroll jobs in October. The combined August and September estimates were revised upwards by 84,000, and unemployment was 4.1%, compared with 4.2% in September. This gives consumer-sensitive businesses a more favourable picture of earlier months, although it does not guarantee stronger sales for every company.
Preliminary third-quarter figures published on 5 November offered another counterweight: non-farm business productivity rose at a 3.6% annualised quarterly rate, while unit labour costs fell at a 0.7% rate. Producing more per working hour can allow wages to increase without an equivalent increase in product prices. However, manufacturing unit labour costs rose, so the overall improvement was not uniform.
? Unit labour costs: are workers earning less?
This measure compares hourly compensation with output per working hour. Labour costs per unit of output can decline even as compensation rises; an annualised quarterly rate is not the actual change over twelve months.
For your investments
Let’s discuss your portfolio
 FINANCIAL FREEDOM01 / 04
Investment results since 1999
Are you beating
global equities?

at the end of the period
Jan 1999–Jun 2026 · EUR · Cumulative return, %
Linear scale · * MSCI World → MSCI ACWI.
Past performance does not guarantee future returns.
FINANCIAL FREEDOM02 / 04Historical comparison
How far did it fall?
How long to recover?
Decline from the previous high

Longest recovery to the previous high

Jan 1999–Jun 2026 · EUR · Monthly data
* MSCI World → MSCI ACWI.
Past performance does not guarantee future returns.
FINANCIAL FREEDOM03 / 04Personal investment consultation
Already investing?
Let’s review your portfolio.
Yet to start
investing?
Let’s build your first
investment plan.
FINANCIAL FREEDOM04 / 04
Personal investment
consultation
Martynas
Juška
Investment manager
Managing a portfolio
of more than€100 million
Rate increases highlighted the risk from energy prices
Australia’s central bank raised its policy rate by 0.25 percentage points to 4.85% on 3 November. The Bank of England raised its rate by the same amount to 4.00% on 5 November. These decisions do not mean that US or euro-area central banks will do the same. They show that new inflation data can change the direction of interest rates even in economies that previously reduced them.
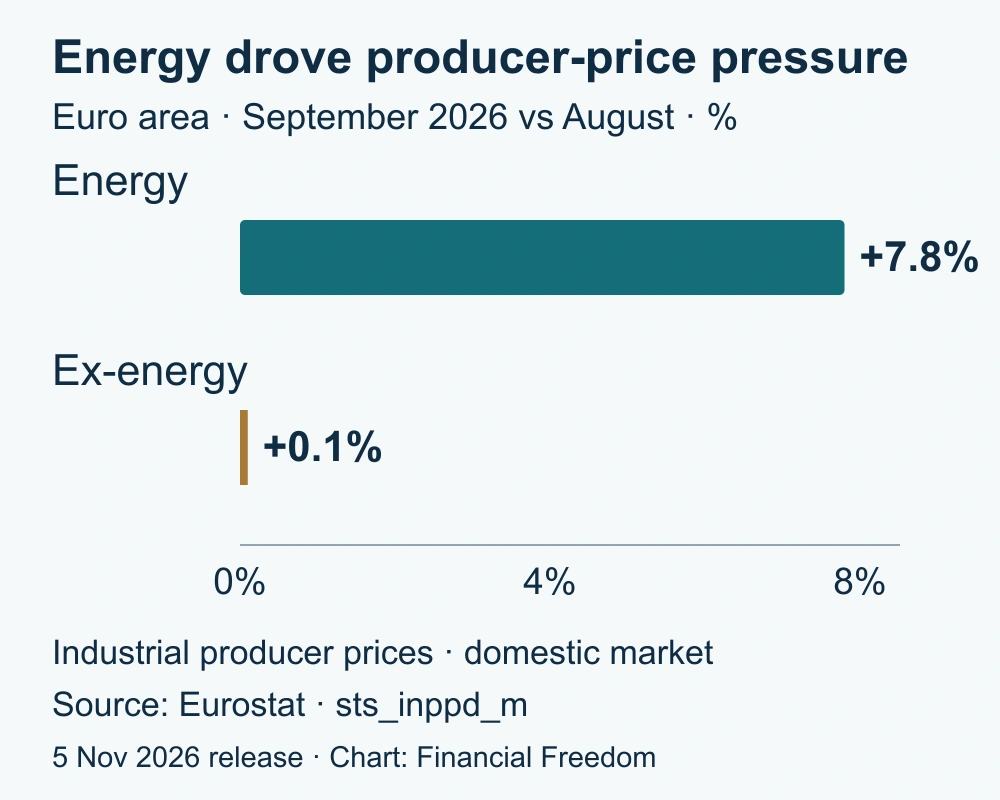
Eurostat’s September figures, released on 5 November, helped explain the pressure: euro-area producer energy prices were 30.8% higher than a year earlier, while producer prices excluding energy rose 3.5%. These measure producers’ selling prices, not the household consumer basket. Energy producers’ revenues and the profits of factories buying that energy can consequently move in different directions.
Monday’s Chinese data added to the seven-day picture
October figures published on 9 November showed annual Chinese consumer-price inflation slowing from 0.9% to 0.7%, while producer-price inflation accelerated from 5.0% to 5.7%. This news belongs to Monday morning, not the completed preceding trading week. It prevents stronger industrial pricing from automatically being treated as evidence of stronger household consumption.
Week
What matters now
A fall in shares and economic weakness are different things
US employment and productivity data leave a more favourable scenario open: corporate sales hold up while labour costs per unit sold ease. That would benefit profitable consumer-service businesses and manufacturers improving their efficiency. The main risk is that energy, interest or new infrastructure expenses outweigh that improvement.
For technology shares, the sector’s prospects matter alongside the price paid for expected earnings. If an earnings forecast falls, a lower share price does not necessarily mean a more attractive valuation. Actual orders matter most to chip suppliers, while data-centre owners also depend on electricity and financing contracts. These investments cannot be treated as identical bets on demand for technology.
US bond yields fell, but interest-rate risk remained
The US Treasury’s comparable ten-year yield fell from 4.94% on 30 October to 4.86% on 6 November. This comparison for the preceding completed week shows that an equity decline did not imply the same direction for every asset class. A falling yield generally supports the prices of existing fixed-rate bonds; it is not a calculated return for a bond fund.
For a euro-based investor, US equities and US bonds also share exposure to the dollar unless their currency risk is hedged. Diversifying asset classes and diversifying currencies are therefore separate decisions. Energy companies can offset some cost risk faced by transport and manufacturing businesses, but their earnings are also sensitive to falling commodity prices. A sector label alone does not provide guaranteed protection.
Week
What comes next
10 November: prices and chip sales will test different assumptions
TSMC, the Taiwanese chip manufacturer, plans to publish October revenue on 10 November at 07:30 Lithuanian time. The question is whether sales in the new quarter support expectations for technology demand. Revenue will not answer every question about profitability, but it is a clearer signal than promised future investment alone.
The US October consumer price index follows that day at 15:30. Slower inflation alongside resilient employment would strengthen the more favourable consumption scenario. Faster inflation would mean greater risk for longer-dated bonds and companies whose valuations rely on profits far into the future. The US producer-price report on 13 November will add evidence from the business side.
9, 10 and 12 November: auctions will test borrowing costs
On these dates the US Treasury will offer three-year, ten-year and thirty-year securities respectively. Strong demand could help contain long-term borrowing costs, while weak demand could increase them. Results should be compared with market yields of the same maturity, not assessed only by the absolute amount of debt sold.
Important. This is general market analysis, not a personal recommendation to buy or sell. Historical data and company results do not guarantee future returns. Forecasts and conditional scenarios may not materialise.
How is the history preserved and updated?
All five periods in this edition share one information date. Week means the latest 7 days, quarter means 90 days, and year means the trailing 12 months. The next dated edition will have a separate URL. This text keeps its date and assessment; later events are not silently inserted into an older edition. Longer periods assess new evidence alongside earlier developments without repeating every headline.