
Year · Market review
Rate cuts gave way to an energy and investment test
On 5 November, the Bank of England raised interest rates again after cutting them in December 2025. That reversal captures the twelve-month story: war and trade decisions changed costs, technology investment supported demand, and November’s equity sell-off showed that a growing business does not justify every price for its shares.
Period covered: 2025-11-10 – 2026-11-09Information as of 11 min read
Decisions in late October and early November confirmed that rate increases had not ended. Political signals after the US election added uncertainty over data-centre costs, while the equity decline coincided with better employment figures.
An energy-supply promise is not delivered fuel, a trade recommendation is not an effective tariff, and a supplier’s profit is not its customer’s investment payback.
Year
What happened
At the end of 2025, cheaper borrowing still looked possible
At the start of this twelve-month period, the Federal Reserve’s interest-rate target range was 3.75–4.00%, while the European Central Bank’s deposit rate was 2.00%. On 10 December, the Federal Reserve reduced its range to 3.50–3.75%. On 18 December, the Bank of England lowered Bank Rate from 4.00% to 3.75%. These were actual decisions to ease borrowing conditions, not a promise to keep cutting throughout the following year.
Japan moved in the opposite direction: on 19 December its central bank announced an increase in the overnight rate target from 0.50% to 0.75%, effective on 22 December. This difference also matters for an international portfolio. Borrowing costs, bond income and currency valuations depend on the particular economy, so a US decision alone does not explain every global investment.
Trade policy also offered signs of relief at the time. Under the US–China agreement announced on 1 November, the US fentanyl-related tariff on Chinese goods was set to fall by 10 percentage points from 10 November 2025. That was a particular historical measure with its own conditions, not a uniform current tariff on every Chinese product. Different duties and export restrictions had different legal foundations.
Trade rules changed in winter, followed by an energy shock in spring
On 26 January 2026, the Council of the European Union approved a gradual phase-out of Russian gas imports. A full liquefied-gas ban is scheduled from early 2027 and a pipeline-gas ban from autumn 2027, with transition periods. Energy buyers therefore need to plan suppliers and contracts ahead; those future deadlines should not be treated as all imports having already stopped.
On 20 February, the US Supreme Court ruled that the International Emergency Economic Powers Act did not authorise presidential tariffs. Duties based on other laws did not disappear. That day, the administration used a different legal basis to announce a temporary 10% import surcharge with exemptions, scheduled from 24 February until 24 July. An exporter therefore needs its product code and the applicable measure’s validity period, not just the political headline.
The Middle East war beginning on 28 February disrupted oil shipments through the Strait of Hormuz. On 11 March, International Energy Agency countries agreed to make 400 million barrels of emergency stocks available, the largest collective amount in the agency’s history. This was a commitment to release stocks over time, not the full volume entering the market that day. Stocks can bridge a supply gap, but cannot replace regular shipments indefinitely.
Provisional application of the European Union’s trade agreement with Argentina, Brazil, Paraguay and Uruguay began on 1 May. Initial tariff relief covered cars, medicines and some food and beverages. Application had begun, although the entire partnership agreement was not finally ratified. European exporters gained an opportunity to compete at a lower final price, but actual revenue still depended on winning orders.
In June, an interim US–Iran ceasefire helped restart some shipping. The International Energy Agency reported on 10 July that Gulf oil exports in June, including routes bypassing the Strait, reached 16.1 million barrels a day, compared with 24 million before the war. However, renewed hostilities on 7–8 July put supply at risk again. This explains why announcing a ceasefire alone was not enough to secure lasting cost relief.
The direction of interest rates reversed during summer and September
On 11 June, the European Central Bank raised its deposit rate to 2.25%, effective on 17 June. On 10 September, it decided on a further increase to 2.50% from 16 September. The Federal Reserve restored its target range to 3.75–4.00% on 16 September. The Bank of Japan announced an increase to 1.00% on 16 June, effective on 17 June, and to 1.25% on 18 September, effective on 24 September.
Australia had started raising rates earlier. Its target increased to 3.85% on 3 February, 4.10% on 17 March, 4.35% on 5 May and 4.60% on 29 September. Each step was 0.25 percentage point. This sequence shows that the energy shock operated alongside domestic demand and capacity constraints; cheaper oil alone could not automatically remove every source of price pressure.
? Central-bank rates: are they the same as a loan’s cost?
No. They influence short-term money-market prices, but a customer’s loan also depends on maturity, the lender’s margin and risk. A change of 25 basis points means 0.25 percentage point, not a 25% increase.
On 23 July, the European Union adopted another sanctions package against Russia, covering financial services, the oil sector and additional vessels. This reinforced the need to check supply routes and transaction conditions. A high commodity price and the ability to deliver that commodity legally and reliably are different things. Energy investments require assessment of both, not simply a view on the direction of oil prices.
On 23 July, the US Trade Representative announced new import duties on 60 economies, including the European Union and China, concerning enforcement of bans on goods produced with forced labour. Tariffs of 10–12.5% and individual exemptions applied from 24 July according to origin and product. This was a new measure under a different legal provision, not a simple extension of February’s temporary surcharge.
On 25–27 September, the US and China presented product groups recommended for tariff relief, roughly US$30 billion in each direction. They included US agricultural products and medical equipment, and Chinese household appliances and toys. A recommendation is not a lower tariff implemented in both countries. A favourable profit effect would require a particular concession to take effect while demand remained intact.
Technology expansion created revenue and dependence on financing
On 26 August, chip designer NVIDIA reported annual revenue growth of 106% for its quarter ending 26 July; operating profit increased by 124%. This confirmed that chip demand was becoming supplier profit. However, the buyer spends cash on equipment before receiving revenue from future customers. Between those two moments it needs electricity, employees and financing, while the equipment depreciates over time.
For your investments
Let’s discuss your portfolio
 FINANCIAL FREEDOM01 / 04
Investment results since 1999
Are you beating
global equities?

at the end of the period
Jan 1999–Jun 2026 · EUR · Cumulative return, %
Linear scale · * MSCI World → MSCI ACWI.
Past performance does not guarantee future returns.
FINANCIAL FREEDOM02 / 04Historical comparison
How far did it fall?
How long to recover?
Decline from the previous high

Longest recovery to the previous high

Jan 1999–Jun 2026 · EUR · Monthly data
* MSCI World → MSCI ACWI.
Past performance does not guarantee future returns.
FINANCIAL FREEDOM03 / 04Personal investment consultation
Already investing?
Let’s review your portfolio.
Yet to start
investing?
Let’s build your first
investment plan.
FINANCIAL FREEDOM04 / 04
Personal investment
consultation
Martynas
Juška
Investment manager
Managing a portfolio
of more than€100 million
On 15 October, Taiwanese chip manufacturer TSMC reported third-quarter revenue of US$46.72 billion and fourth-quarter guidance of US$52.3–54.3 billion. The chip manufacturer’s results supported the technology-demand case. They also highlighted concentration risk: chip, equipment and data-centre businesses in different countries can depend on the same investment cycle. The number of regions in a fund does not reveal how many independent business drivers it holds.
The autumn recovery in energy supply was uneven
The International Energy Agency’s 14 October report put September global oil supply at 102.3 million barrels a day, 2.5 million more than in August. Renewed attacks in the Gulf nevertheless showed that the recovery was fragile. Crude oil, refined fuel and delivery are not interchangeable. Transport expenses can therefore remain high even when conditions improve at an earlier production stage.
On 5 November, Eurostat reported that euro-area producer prices had increased 11.1% year on year in September. Excluding energy, the rise was 3.5%. On 9 November, China’s statistics showed annual October producer-price growth of 5.7% and consumer-price growth of 0.7%. The higher first measure does not itself imply an equivalent future increase in shop prices: businesses may absorb some costs through lower profit.
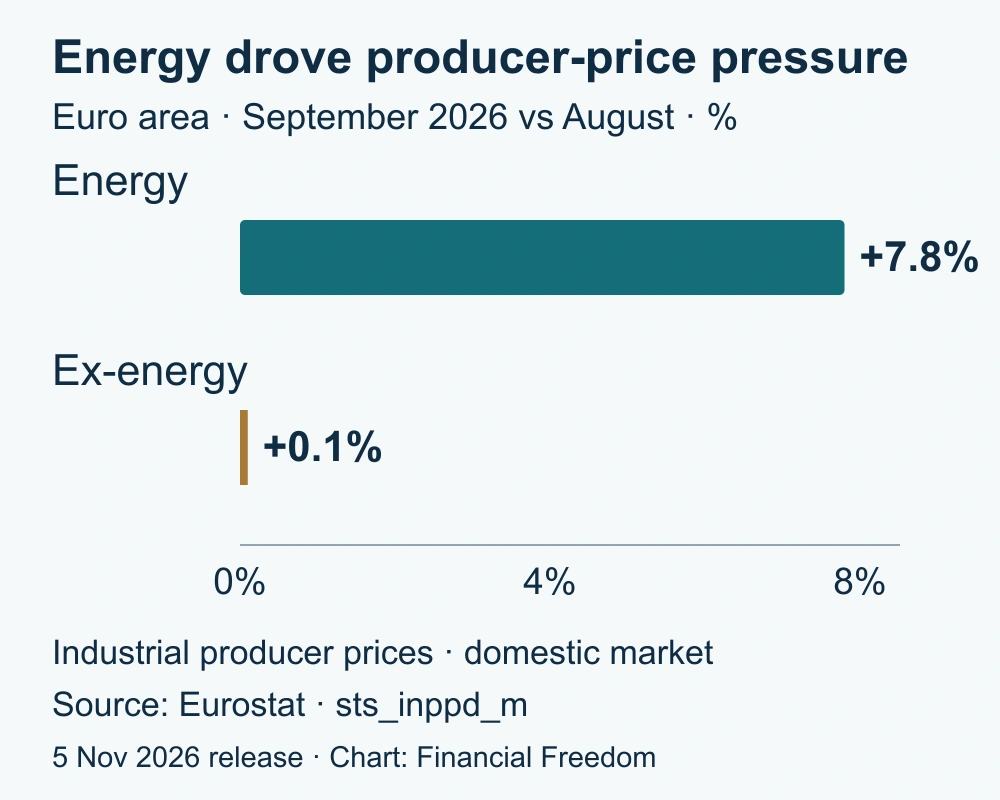
? Producer prices: what does this measure leave out?
It measures prices of goods sold by producers in the specified market, not every company’s costs or profit margin. Consumer-price baskets and weights differ, so the gap between these indices cannot be called a change in company profits.
Late-October and November decisions challenged hopes of general easing
The US, euro-area and Japanese central banks retained their latest policy levels on 28, 29 and 30 October respectively. The Bank of Canada raised its target from 2.25% to 2.50% on 28 October, Australia’s central bank from 4.60% to 4.85% on 3 November, and the Bank of England from 3.75% to 4.00% on 5 November. Countries were therefore not moving together through one rate-cutting phase.
On 30 October, the Bank of Japan also decided to increase disposals of its exchange-traded fund holdings from January 2027: from 330 billion to 860 billion yen a year at book value. This is a future disposal programme, not a volume already sold in November. Japanese equities also depend on private buyers, company profits and the yen; the plan alone cannot explain the entire market’s movement.
Following the US election on 3 November, Senator Sheldon Whitehouse said on 4 November that Democrats had won control of both chambers of Congress. On 5 November, Senate Democratic leader Chuck Schumer’s proposed agenda included changing tariffs and preventing data-centre electricity-infrastructure costs being passed to households. These are attributed political statements, not a final seat tally or an enacted law. Specific financial provisions would still have to be resolved through legislation.
On 5 November, the US Nasdaq Composite price index declined 5.52% and the S&P 500 fell 4.36%. Between 30 October and 6 November, Nasdaq lost 3.37% and Japan’s Nikkei 225 fell 9.25%. This is a one-week episode in the year’s story, not a twelve-month return. A political speech coinciding with a decline does not prove it was the sole reason every investor sold.
Economic figures did not establish an unambiguous recession. On 6 November, the US reported 165,000 additional non-farm jobs in October and unemployment of 4.1%. The preliminary third-quarter release on 5 November showed productivity increasing at a 3.6% annualised rate and unit labour costs falling 0.7%. This is a counterweight to price pressure, not a guarantee of profit at every company.
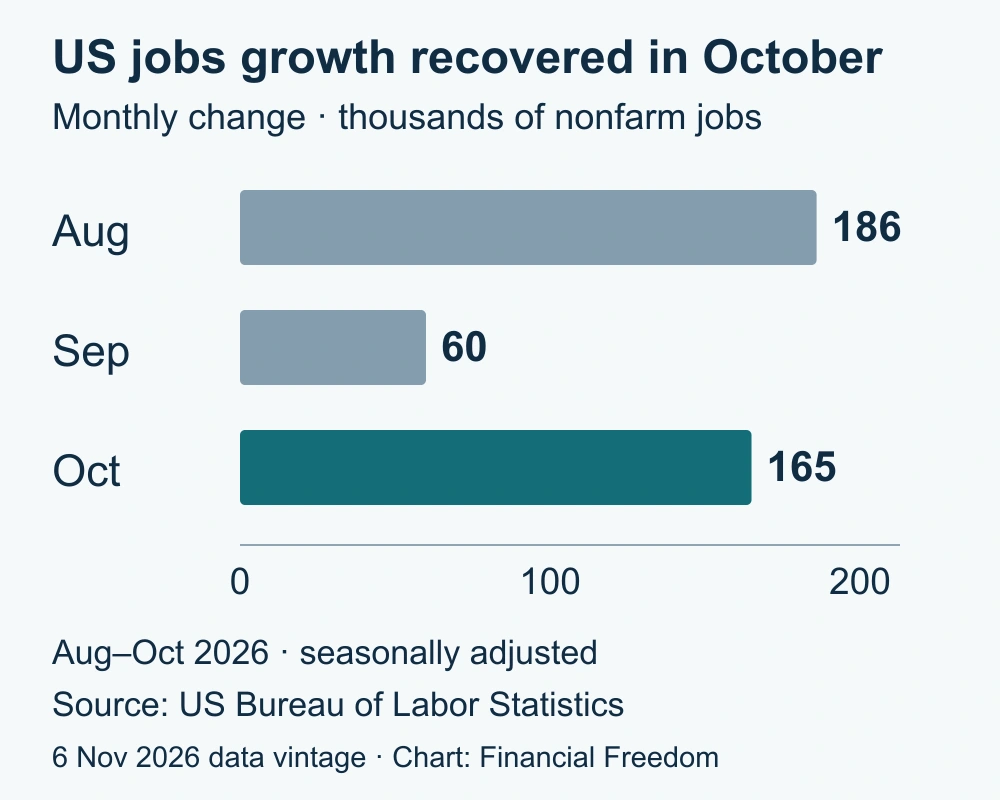
? Productivity and unit labour costs: how should quarterly figures be read?
Productivity is real output per hour worked; unit labour costs relate compensation expenses to production. Annualisation shows what would happen if the quarterly pace lasted a year. Lower unit costs do not mean an employee’s pay is falling.
Year
What matters now
Interest-rate risk and credit risk are different
Longer-dated fixed-rate government bonds may rise in price if weaker demand lowers expectations for future interest rates. But an inflationary supply disruption can reduce company profits while also leading investors to demand higher bond yields. Equities and bonds would then not necessarily offset each other’s declines. What matters is not simply greater anxiety, but its underlying cause.
A corporate bondholder must additionally consider the borrower’s ability to repay on time. Even when government yields fall, a weaker borrower may have to pay a larger premium. A short-term deposit, a high-quality bond and debt financing data-centre expansion are therefore not equivalent choices merely because all pay interest. Their maturities, potential losses and conditions for getting money back differ.
In energy, distinguish price from reliable delivery
The latest US Energy Information Administration (EIA) Brent level published before the review cutoff was US$107.03 a barrel for 3 November, compared with US$120.15 on 30 October. This is a partial-week comparison. It does not reprice every transport contract or show today’s level for every type of oil. Different contracts, stocks and fuel products determine how quickly expenses change.
Sustainably cheaper and more reliable fuel deliveries would help airlines, road transport and energy-intensive European industry. Lower selling prices would work in the opposite direction for oil producers, although greater sales volumes could offset part of the effect. A renewed delivery interruption is a risk on both sides. Geographical diversification helps only to the extent that supply routes and customers actually differ.
Technology investment must be assessed on both sides of the transaction
A data-centre order is potential revenue for an equipment supplier; for the buyer it is expenditure that must still earn a return. A chip company’s shares and a loan to its customer therefore carry different risks. The former is sensitive to orders, profitability and the valuation investors put on its shares. The latter depends on cash flows, loan terms and access to further funding before the project pays back.
A practical comparison goes beyond revenue-growth rates. It considers cash remaining after operations and investment, debt maturities and the speed at which equipment becomes obsolete. The opportunity would be new capacity used by paying customers, allowing growth without continually increasing borrowing. The risk is several companies expanding at once on the strength of the same assumed future demand.
Currency and the measurement period change an individual’s result
US index moves are measured in dollars, Japanese ones in yen. A euro-based investor also needs to know whether the fund hedges currency exposure and what that hedge costs. A price index excludes dividends, while a fund’s result depends on fees and actual positions. A weekly decline in one index therefore cannot simply be equated with an annual loss across an entire personal portfolio.
Year
What comes next
10 November, 15:30 Lithuanian time: US October consumer prices will help determine whether improving jobs and productivity are compatible with easing inflation pressure. That matters for long-dated bonds and for businesses whose share prices depend heavily on profits many years ahead.
12–13 November: the scheduled EIA Brent update and US October producer prices will provide newer information about fuel and production prices. The question is whether relief at one stage reaches others, rather than simply lowering one isolated quotation.
8–9 December: the next scheduled Federal Reserve meeting takes place, followed by the Bank of England decision on 17 December. Will the banks see enough easing in price pressure to regard existing interest rates as sufficient, rather than increase them again?
From January 2027: the Bank of Japan plans faster fund disposals; the full EU ban on Russian liquefied-gas imports is scheduled for the same early-year period. Investors need actual implementation flows, contractual exceptions and company adjustments, not just the previously announced direction.
Important. This is general market analysis, not a personal recommendation to buy or sell. Historical data and company results do not guarantee future returns. Forecasts and conditional scenarios may not materialise.
How is the history preserved and updated?
All five periods in this edition share one information date. Week means the latest 7 days, quarter means 90 days, and year means the trailing 12 months. The next dated edition will have a separate URL. This text keeps its date and assessment; later events are not silently inserted into an older edition. Longer periods assess new evidence alongside earlier developments without repeating every headline.